- Title
-
Differential levels of Neurod establish zebrafish endocrine pancreas cell fates
- Authors
- Dalgin, G., Prince, V.E.
- Source
- Full text @ Dev. Biol.
|
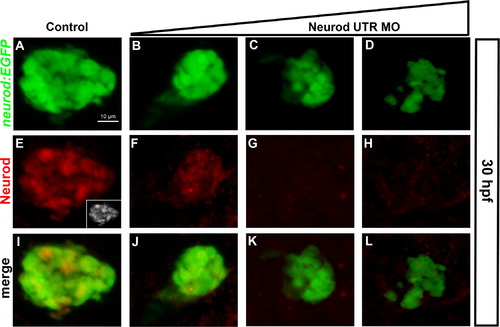
Morpholino knockdown causes progressive depletion of Neurod. Whole mount immunolabeling for GFP (green) and Neurod (red) protein. Confocal images (merged z-stacks) of the dorsal pancreatic bud in Tg(neurod:EGFP) embryos at 30 hpf. (A, E, I) Control embryos; (E; inset) gray scale. Neurod UTR MO injected specimens (B, F, J) 2 ng/embryo, (C, G, K) 4 ng/embryo (D, H, L) 8 ng/embryo. Scale bar=10 µm. |
|
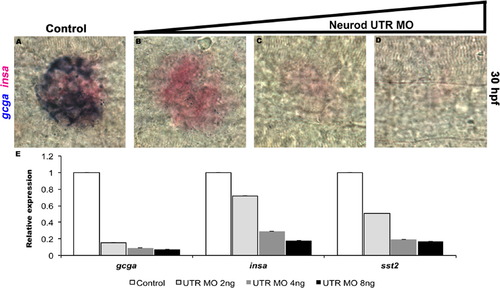
Quantitative analysis of Neurod morphant endocrine cell differentiation. Double in situ hybridization for glucagon (gcga, blue) and insulin (insa, red) at 30 hpf. Control (A), Neurod UTR MO 2 ng (B), 4 ng (C) or 8 ng (D) injected specimens. Results are representative of two independent experiments and from a minimum of 20 embryos per group. (E) Relative levels of gcga, insa and sst2 by real-time qPCR. Results are from 2 independent experiments and from 3 technical replicates and confirmed by two independent primer sets per gene of interest. All values were normalized to beta-actin levels. Primer sequences are listed in Table S1. |
|
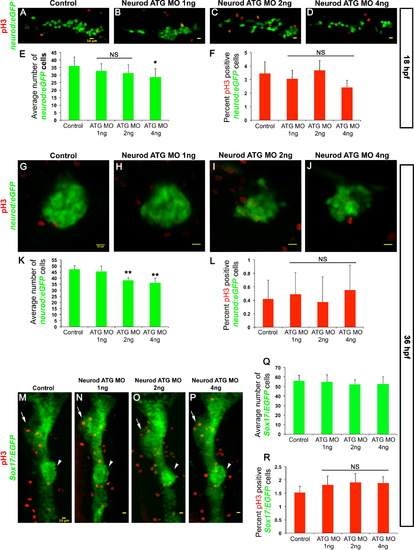
Neurod-deficient endocrine cells remain undifferentiated and have normal proliferation rate. Confocal images (merged z-stacks) of representative 18 hpf (A–D) and 36 hpf (G–H) Tg(neurod:EGFP) and 36 hpf Tg(sox17:EGFP) (M–P) embryos. Control (A, G, M), Neurod ATG MO 1 ng (B, H, N), 2 ng (C, I, O) or 4 ng (D, J, P) injected specimens. Whole mount immunolabeling for pH3 (red, A–D, G–J, M–P). Mean (±s.d.) number of cells expressing GFP (E, K, Q) and proliferation rate is shown as mean (± s.d.) percentage of cells expressing pH3 and GFP (F, L, R) from 2 independent experiments and from a minimum of 10 embryos per group. *P<0.013, **P<0.001; t-test, two-tailed distribution. NS, not significant. Embryos are oriented anterior to the left (A–D, G–J) and to the top (M–P). Arrows indicate liver and arrowheads indicate dorsal pancreas region. Yellow scale bar=10 µm. |
|
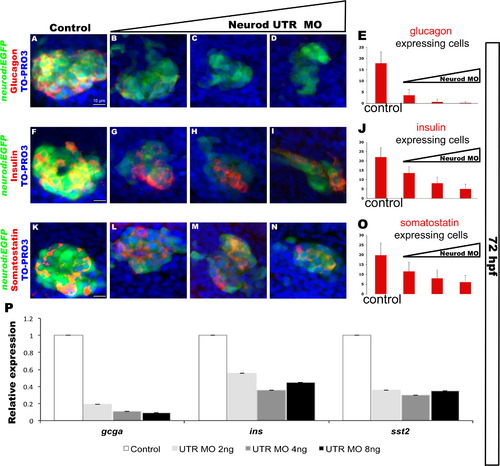
Neurod is also required for differentiation of endocrine cells from the ventral bud. Confocal images (merged z-stacks) of representative 72 hpf Tg(neurod:EGFP) embryos. Whole mount immunolabeling for glucagon (red, A–D), insulin (red, F–I), somatostatin (red, K–N), GFP (green), with nuclear staining TO-PRO-3 (blue). Control (A, F, K), Neurod UTR MO 2 ng (B, G, L), 4 ng (C, H, M) or 8 ng (D, I, N) injected specimens. Mean (±s.d.) number of cells expressing glucagon (E), insulin (J) and somatostatin (O) from 5 independent experiments and from a minimum of 55 embryos per group. (P) Relative levels of gcga, insa and sst2 by real-time qPCR. Results are from 2 independent experiments and from 3 technical replicas and confirmed by two independent primer sets per gene of interest. All values were normalized to beta-actin levels. Primer sequences are listed in Table S1. White scale bar=10 µm. |
|
Increased Neurod levels promote alpha cell differentiation; beta cells are less sensitive than alpha cells to Neurod knockdown. (A-R) Confocal images (merged z-stacks) of representative 52 hpf chimeric specimens in which the entire endoderm is derived from control (A-F), Neurod morphant (G-L) or neurod mRNA injected (M-R) donor cell transplants. Embryos are immunolabeled for EGFP (green; A, D, G, J, M, P) for glucagon (blue; B, H, N) and for insulin (blue; E, K, Q). EGFP and Rhodamine Dextran (red) labels donor-derived cells (A, D, G, J, M, P). Merged images with all three colors are also shown (C, F, I, L, O, R). (S) Mean (± s.d.) average number of cells expressing glucagon and EGFP-expressing endocrine cells, from a minimum of 4 chimeric embryos per group. *, P<0.002, **, P<0.01; t-test, two-tailed distribution. (T) Mean (± s.d.) average number of cells expressing insulin and EGFP-expressing endocrine cells, from a minimum of 5 chimeric embryos per group. *, P<0.004; t-test, two-tailed distribution. Scale bar=10 µm. |
|
IPD-derived secondary endocrine cells, formed in response to inhibition of Notch signaling, are sensitive to Neurod knockdown. Experimental schedule (top); Tg(neurod:EGFP) control and Neurod morphant larvae were treated with 3 µM RO4929097 (γ-secretase inhibitor) from 3 to 6 dpf. Confocal images (merged z-stacks) of representative 6 dpf Tg(neurod:EGFP) untreated specimen (A, E), γ-secretase inhibitor treated specimen (B, F), γ-Secretase inhibitor treated Neurod ATG morphant [1 ng] (C, G) and γ-secretase inhibitor treated Neurod UTR morphant [2 ng] (D, H). Whole mount immunolabeling for GFP (green) and glucagon (red) (A–D) or for GFP (green) and insulin (red) (E–H). Mean (±s.d.) number of cells expressing glucagon (I) or insulin (J) from 4 independent experiments and from a minimum of 40 and 25 larvae per group, respectively. *P<0.0001; t-test, two-tailed distribution. Primary endocrine islet (arrow), IPD-derived endocrine cells (red line). Magnification is different in panel A than in B–H. Scale bar=20 µm. |
|
Neurod knockdown increases production of secondary endocrine precursor cells. Confocal images (merged z-stacks) of representative 6 dpf Tg(neurod:EGFP) Control (A, C, E, G) and Neurod ATG morphant (B, D, F, H) specimens. Whole mount immunolabeling for insulin (C, D), glucagon (E, F) and GFP (G, H). (I) Mean (±s.d.) number of cells expressing insulin, glucagon, GFP-positive secondary endocrine cells from 6 independent experiments and from a minimum of 20 larvae per group. *P<0.0001; t-test, two-tailed distribution. Secondary endocrine precursor cells; arrowhead. Scale bar=20 µm. |
|
Neurod morphants treated with sodium glucose cotransporter inhibitor retain increased production of secondary endocrine cells. (A) Experimental schedule. 1 ng of Neurod ATG MO injected Tg(neurod:EGFP) specimens were treated with 250 µg/ml Phloridzin (Phz) at 5.5 dpf for 16 h and collected for free glucose assay. (B) Free glucose levels in 6 dpf Tg(neurod:EGFP) untreated and Phz treated control and Neurod morphant specimens. Phz treatment normalized glucose levels in Neurod morphants. Mean (±s.e.m) glucose levels from 4 independent experiments. (C) Mean (±s.d.) number of cells expressing GFP-positive secondary endocrine cells from 4 independent experiments and from a minimum of 16 larvae per group. Confocal images (merged z-stacks) of representative 6 dpf Tg(neurod:EGFP) control (D, H, L, P), control treated with phlorizin (Phz) (E, I, M, Q), Neurod ATG morphant (F, J, N, R) and Neurod ATG morphant treated with Phz (G, K, O, S). Whole mount immunolabeling for GFP (green, D–G), glucagon (red, H–K), insulin (blue, L–O) and merged images with nuclear marker DAPI (P–S). *P<0.007, **P<0.0005; t-test, two-tailed distribution. Secondary endocrine precursor cells; arrowhead. White scale bar=10 µm. |
|
Neurod sgRNA/Cas9 mediated transient mutagenesis phenocopies the endocrine cell defects found in Neurod morphants. (A) Control and (B) neurod sgRNA/Cas9 injected specimens at 48 hpf. No gross morphological defects were observed. (C) T7 endonuclease I assay (T7EI) assay. (Lane 1) marker, (lane 2) untreated and (lane 3, 4) T7EI treated amplicons from control embryos. (Lane 5–15) Amplicons from embryos injected with neurod sgRNA/Cas9 were digested in varying ratios by T7EI enzyme. Asterisks indicate the PCR product that was TOPO cloned and sequenced. (D) The sequence alignment of wild type (wt), insertion (18/20, red) and deletion (2/20, green) mutations recovered from sequenced clones. Neurod sgRNA genomic target sequence (blue), protospacer adjacent motif-PAM sequence (pink). (E) Relative levels of gcga, insa, sst2, neurod and cp by real-time qPCR. Results are from 3 independent experiments and from 2 technical replicas. All values were normalized to beta-actin levels. Primer sequences are listed in Table S1. |
|
Neurod-deficient specimens have normal gross morphology. Control and 3 different concentrations of Neurod UTR MO injected specimens at 3 dpf. No gross morphological defects were observed. |
|
False-colored images of control and Neurod morphant specimens. Confocal images (merged z-stacks) of the dorsal pancreatic bud in Tg(neurod:EGFP) from Fig. 1 were false colored using ImageJ. (A, E) Control embryos. Neurod UTR MO injected specimens, (B, F) 2 ng/embryo, (C, G) 4 ng/embryo, (D, H) 8 ng/embryo. Fire scale heat map; high intensity (white) low intensity (black). White scale bar =10 µm. |
|
Dorsal bud endocrine cell types display differential sensitivity to Neurod knockdown. In situ hybridization for glucagon (gcga, A-D), insulin (insa, F-I), somatostatin2 (sst2, K-N) and aristaless related homeobox a (arxa, P-S) at 30 hpf. Control (A, F, K, P), Neurod UTR MO 2 ng (B, G, L, Q), 4 ng (C, H, M, R) or 8 ng (D, I, N, S) injected specimens. Mean (± s.d.) number of cells expressing gcga (E), insa (J), sst2 (O) and arxa (T) from four independent experiments and from a minimum of 20 embryos per group. Arrowheads indicate dorsal bud endocrine cells. |
|
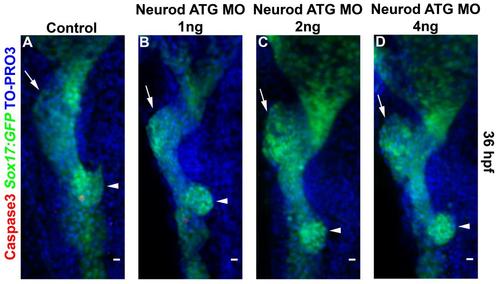
Neurod morphant specimens have normal levels of cell death. Confocal images (merged z-stacks) of representative 36 hpf Tg(sox17:EGFP) embryos. Whole mount immunolabeling for Caspase3 (red) and with nuclear staining TO-PRO-3 (blue). Representative specimens of control (A), Neurod ATG MO 1 ng (B), 2 ng (C) or 4 ng (D) injected specimens, from 2 independent experiments and from a minimum of 10 embryos per group. |
|
Neurod-deficient endocrine cells remain undifferentiated and have normal proliferation rate. Representation of confocal images (merged z-stacks) in Fig. 3, together with nuclear marker TO-PRO3. 18 hpf (A-D) and 36 hpf (E-H) Tg(neurod:EGFP) and 36 hpf Tg(sox17:EGFP) (I-L) embryos. Control (A, E, I), Neurod ATG MO 1 ng (B, F, J), 2 ng (C, G, K) or 4 ng (D, H, L) injected specimens. Whole mount immunolabeling for pH3 (red, A-L). (M) Schematic representation of Tg(sox17:EGFP) embryo. The red box indicates the dorsal pancreatic bud; pH3 and GFP-positive cells were counted from the tip of the dorsal bud going ventral towards the gut tube to determine proliferation rate in the specimens. Arrows indicate liver and arrowheads indicate dorsal pancreas region (I-L). Scale bar=10 µm. |
|
Neurod is also required for differentiation of endocrine cells from the ventral bud. Single channel confocal images (merged z-stacks) of Fig. 4 are shown. Whole mount immunolabeling for glucagon (red, E-F), insulin (red, M-P), somatostatin (red, U-X), GFP (green). Control (A, E, I, M, Q, U), Neurod UTR MO 2 ng (B, F, J, N, R, V), 4 ng (C, G, K, O, S, W) or 8 ng (D, H, L, P, T, X) injected specimens. |
|
Label retaining cell analysis confirmed that early (dorsal) and late (ventral) born endocrine cells are similarly affected in Neurod morphants. Confocal images (merged z-stacks) of representative 60 hpf Tg(neurod:EGFP) embryos injected with H2B-RFP mRNA (red). GFP channel is not shown and hormone markers are false colored in green for presentation. Whole mount immunolabeling for insulin (green, |
|
Neurod-deficient specimens have normal acinar cell development. Confocal images (merged z-stacks) of representative 72 hpf Tg(ptf1a:EGFP) embryos. Whole mount immunolabeling for glucagon (blue, A-D), insulin (red, E-H), GFP (green, I-L). Control (A, E, I, M), Neurod ATG MO 1 ng (B, F, J, N), 2 ng (C, G, K, O) or 4 ng (D, H, L, P) injected specimens. Merged images with all three colors are also shown (M-P). Results are representative of 2 independent experiments and from a minimum of 15 embryos per group. White scale bar=10 µm. |
|
Cell transplantation approach.Tg(neurod:EGFP) embryos were used to follow the fate of transplanted cells in chimeric embryos. (A) Confocal image (merged z-stack) of an uninjected 52 hpf Tg(neurod:EGFP) embryo; arrow indicates EGFP expression in the pancreas. (B) Sox32 morphant embryos, which lack endoderm, were used as hosts. (C) Tg(neurod:EGFP) donor embryos were injected with rhodamine dextran (RD; red) lineage tracer and sox32 mRNA. Donors were additionally injected with nothing, Neurod ATG MO or neurod mRNA, to generate control, Neurod morphant or Neurod overexpressing donor cells, respectively. Donor cells were transplanted into Sox32 morphant hosts. A confocal image is shown of a chimeric embryo with a fully reconstituted donor-derived endoderm (red) expressing EGFP-positive endocrine cells (arrow). Anterior to left in all specimens. White scale bar=50 µm. |
|
Increased Neurod levels do not promote beta to alpha cell fate change. (Top panel) Transplantation strategy; Tg(mnx1:GFP) donor cells were used to follow the fate of transplanted cells in endoderm deficient wild type hosts. Control or Neurod overexpressing donor cells were mosaic; Tg(mnx1:GFP) (green) or non-Tg(mnx1:GFP) (black). (A-I) Confocal images (merged z-stacks) of representative 52 hpf unmanipulated Tg(mnx1:GFP) specimens (A-C), chimeric specimens in which the entire endoderm is derived from control (D-F), or neurod mRNA injected (G-I) donor cell transplants. Embryos are immunolabeled for EGFP (green), for glucagon (red; A, D, G) and for insulin (blue; B, E, H). EGFP labels donor-derived beta cells (A, B, D, E, G, H). Merged images with all three colors are also shown (C, F, I). Results are representative of 4 chimeric specimens per group. White scale bar=10 µm. |
|
Whole mount in situ hybridization for neurod (A-D), glucagon (gcga, E-H), and aristaless related homeobox a (arxa, I-L) at 6 dpf. Control (A, E, I), γ-secretase inhibitor treated (B, F, J), Neurod ATG morphant (C, G, K) and Neurod UTR morphant (D, H, L) γ-secretase inhibitor treated larvae. Pancreas is indicated, primary islet (arrow), secondary endocrine cells (line). |
Reprinted from Developmental Biology, 402(1), Dalgin, G., Prince, V.E., Differential levels of Neurod establish zebrafish endocrine pancreas cell fates, 81-97, Copyright (2015) with permission from Elsevier. Full text @ Dev. Biol.

