
- Title
-
Loss of tropomodulin4 in the zebrafish mutant träge causes cytoplasmic rod formation and muscle weakness reminiscent of nemaline myopathy
- Authors
- Berger, J., Tarakci, H., Berger, S., Li, M., Hall, T.E., Arner, A., Currie, P.D.
- Source
- Full text @ Dis. Model. Mech.

The mutant träge (trg) shows a reduction in birefringence, indicating muscle damage. (A) Under brightfield microscopy, trg mutants appear similar to their wild-type siblings. (B) Under polarised light, the muscle of siblings appears brighter than that of the (B′) trg mutants due to a reduction in birefringence. (C) Quantification of the birefringence followed by normalization to that of 3-dpf-old siblings reveals that the birefringence of the siblings increases from 3 dpf to 6 dpf, roughly following a sigmoidal curve. By contrast, 3-dpf- to 6-dpf-old trg larvae show a highly significant reduction in birefringence when compared with that of 3-dpf siblings (P<0.01, n=3). (D) Immunohistochemistry with antibodies against dystrophin shows that dystrophin expression at the vertical myosepta (arrowheads) is unaffected in trg mutants. Data are means ± s.e.m., **P<0.01. Scale bar: 200 μm. EXPRESSION / LABELING:
PHENOTYPE:
|
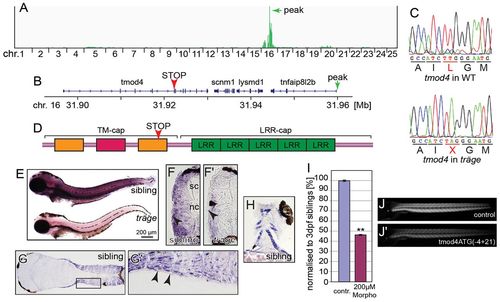
Träge carries a tmod4 loss-of-function allele. (A) Linkage analysis of trg mutants through SNPtrack resulted in a peak at 31.96 Mb on chromosome (chr.) 16 (marked by green arrow). (B) Within the locus lies tmod4 that carries a nonsense mutation, indicated by a red arrowhead. (C) The triplet TTG that encodes a leucine residue in wild-type tmod4 is mutated to the stop codon TAG in tmod4trg mutants (L132X). (D) Schematic of Tmod4 shows the tropomyosin and actin-capping domain (TM-cap) that comprises two tropomyosin-binding helices (orange) and one actin-binding helix (red) together with the actin-binding domain (LRR-cap) with its five leucine-rich repeats. The arrowhead marks the location of the L132X mutation. (E) Whole-mount in situ hybridization at 3 dpf shows an abundance of tmod4 transcript in trunk muscle that is strikingly reduced in tmod4trg, suggesting nonsense-mediated decay. (F,F′) The weaker in situ signal in tmod4trg is also noted on cross sections. Interestingly, tmod4 transcript is absent from the superficial slow muscle fibres (arrowheads), spinal cord (sc) and notochord (nc). Longitudinal sections show muscle-specific tmod4 transcript in the (G,G′) trunk and (H) head musculature. G′ shows an enlarged image of the region of interest in G. (I–J′) Administration of 200 μM of tmod4ATG(4+21) into wild-type embryos phenocopied tmod4trg mutants by inducing a highly significant reduction in birefringence after normalization to control-injected embryos (P<0.01, n=3). (I) Quantification results, data are means ± s.e.m., **P<0.01. (J,J′) example images. contr., control; WT, wild type. EXPRESSION / LABELING:
PHENOTYPE:
|
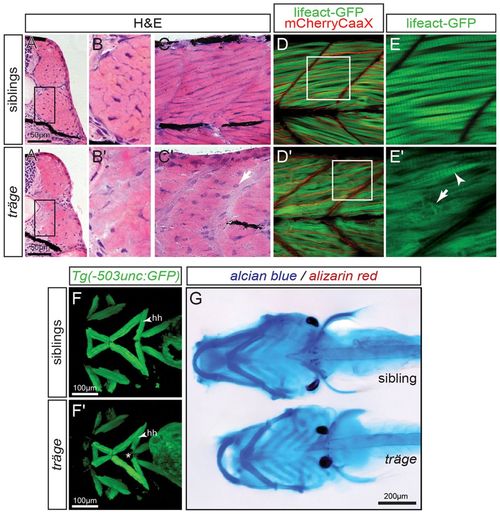
Muscle phenotype of tmod4trg. (A) In comparison to their siblings, (A′) myofibres in H&E-stained cross sections of tmod4trg larvae show less defined cell shapes and inhomogeneous eosin staining at 3 dpf. (B,B′) Magnified views of the respective boxes indicated in A and A′. (C,C′) Accordingly, myofibres on sagittal sections of tmod4trg mutants appear unstructured, and blue haematoxylin-stained nuclei (arrow) are rounder in shape compared with those of siblings. (D) In a sagittal view of 3-dpf-old siblings, the myofibrils show typical striation, when marked by using the transgenic line Tg(acta1:lifeact-GFP). In addition, the transgenic background Tg(acta1:mCherryCAAX) labels the sarcolemma in red, showing that myofibrils occupy most of the myofibres. (D′) In matching tmod4trg mutants, the myofibril striation is rarely seen (arrowhead in E′), instead myofibres are filled with misorientated thin filaments (arrow in E′). (E,E′) Magnifications of respective boxes in D and D′. (F,F′) GFP highlights the cephalic musculature in the transgenic background of Tg(-503unc:GFP), here shown as ventral views of z-stack projections. (F) In contrast to their siblings, (F′) the two hyohyoideus (hh) muscles in tmod4trg mutants leave a gap between each other (asterisk). (G) Focus stacks of larvae that were stained with Alcian blue and Alizarin red depict cartilage malformations in tmod4trg at 6 dpf. EXPRESSION / LABELING:
PHENOTYPE:
|
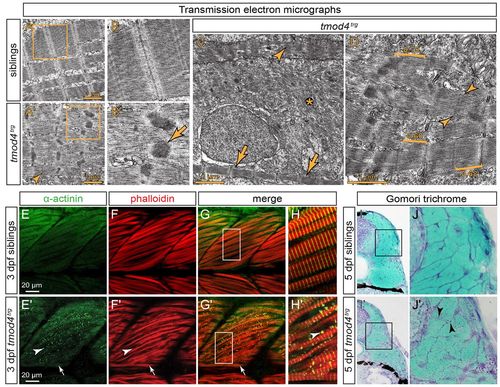
Cytoplasmic rod formation in tmod4trg. (A) Transmission electron micrographs of skeletal muscle from siblings at 3 dpf display the typical myofibril striation and well-aligned sarcomeres. (A′) In contrast, the myofibrils of tmod4trg mutants appear non-uniform, and filaments are misoriented. Sarcomere H-zones are less defined (arrowhead) and Z-disks are widened with electron-dense inclusions of various sizes and shapes. (B,B′) Magnified views of the respective boxes in A and A′ reveal the lattice pattern of the cytoplasmic rods (arrow) that is typical for nemaline rods of individuals with NM. (C) In addition to abnormal sarcomeres (arrowhead), organised sarcomeres (arrows) rarely form in tmod4trg, and filaments are often scattered throughout myofibres (asterisk). (D) Brackets mark the various lengths of thin filaments of tmod4trg from short (0.60 μm) to long (0.75 μm). In organised myofibrils, thin filaments are of lengths comparable to those of siblings (0.68 μm). Indistinct H-zones are marked by arrowheads. (E–H) At 3 dpf, labelling of F-actin with phalloidin (red) and actinin using an antibody (green) shows the typical myofibril striation in siblings. (G,H) Merged images, H shows magnification of the boxed area indicated in G. (E′-H′) In tmod4trg mutants, actinin and actin colocalize in cytoplasmic aggregations. In contrast to the internal fast myofibres that show abundant cytoplasmic rods (arrowheads), the superficial slow muscle fibres, which in zebrafish form a single layer on the lateral outline of the somites, do not display cytoplasmic rods (arrows). (G′,H′) Merged images, H′ shows magnification of the boxed area indicated in G′. (I,I′) On cross sections at 5 dpf, Gomori trichrome staining indicates the presence of cytoplasmic rods in tmod4trg that are reminiscent of nemaline rods. (J,J′) Magnifications of boxes indicated in I and I′, respectively. Arrowheads mark nemaline-like cytoplasmic rods. EXPRESSION / LABELING:
PHENOTYPE:
|
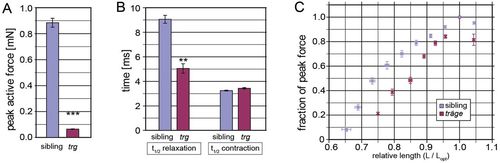
The tmod4trg skeletal muscle has impaired force generation. (A) Peak active force at optimal length in tmod4trg is significantly lower than that of siblings (n=6). (B) During single-twitch contraction, the half-time (t1/2) of contraction is similar in tmod4trg and siblings, however, the relaxation time is significantly prolonged in tmod4trg (n=6). (C) Length–active force curves show steeper ascending limb in tmod4trg (red) than in siblings (blue) (n=5). Force is normalised to the maximal active force at optimal length (Lopt), and length is normalised to Lopt. Data are means ± s.e.m., **P<0.01, ***P<0.001. PHENOTYPE:
|

Western blot analysis using polyclonal antibody against human TMOD4. At 39 kDa, the theoretical molecular weight of zebrafish Tmod4, a band appears in wildtype (WT) that is absent in the tmod4trg mutant (trg), marked by black arrow. Red arrows mark bands of slightly lower molecular weight in both genotypes, likely representing Tmod1 or Tmod3 that are similar to Tmod4 in molecular weight and sequence. Compared to human TMOD4, zebrafish Tmod4 is 74%, Tmod1 is 56%, and Tmod3 is 57% identical. EXPRESSION / LABELING:
|

Unillustrated author statements |