- Title
-
A living biosensor model to dynamically trace glucocorticoid transcriptional activity during development and adult life in zebrafish
- Authors
- Benato, F., Colletti, E., Skobo, T., Moro, E., Colombo, L., Argenton, F., Dalla Valle, L.
- Source
- Full text @ Mol. Cell. Endocrinol.
|
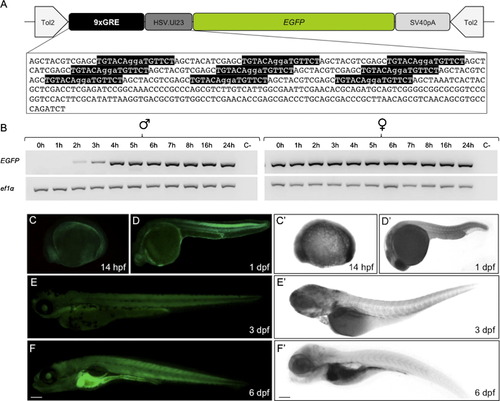
Generation of the GRE-responsive line and developmental profile of GRE-mediated transcriptional activity of Tg(9×GCRE-HSV.Ul23:EGFP)ia20 embryos and larvae (transgenic males crossed with WT females). (A) Schematic representation of the 9×GCRE-HSV.Ul23:EGFP reporter construct designed in this study. The construct consists of a 0.45-kb fragment encoding nine repeating GREs (in black) from the rat tyrosine aminotransferase promoter ( Grange et al., 1991) and a thymidine kinase (tk) promoter (HSV.Ul23, in dark grey) inserted upstream of the egfp ORF (in green). The SV40 polyA signal (SV40pA in grey), which contains a transcriptional termination element, is directly downstream of the EGFP ORF and the entire element is flanked by Tol2 transposable elements. (B) RT-PCR analysis of egfp expression from the offspring of transgenic female or male and wild type mates at stages ranging from 0 up to 24 hpf. Expression of ef1a was used as a cDNA loading control. Fluorescence microscopy (C-F) and light microscopy (C′-F′) lateral views of zebrafish embryos and larvae at 14 hpf and 1, 3 and 6 dpf displaying the EGFP accumulation sites and the egfp mRNA localization during development. The protein and mRNA are first detectable at 14 hpf, when they both are ubiquitously distributed, with higher signals in the developing head and tail region (C-C′). The EGFP protein/mRNA localization remains the same by 1 dpf (D-D′), while it is visible in distinct domains, such as brain, liver and pronephros at 3 dpf (E-E′). By 6 dpf, the reporter expression is particularly intense in liver, intestine and pronephros (F-F′). Scale bar: 200 µM. |
|
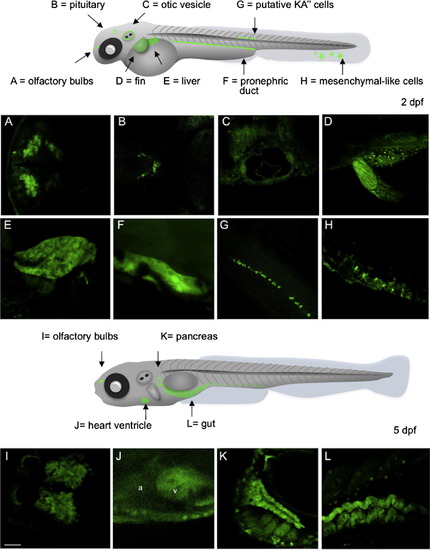
Reporter expression in untreated 2- and 5-dpf transgenic zebrafish (transgenic males crossed with WT females). Top panel: schematic representation of a 2-dpf embryo indicating the EGFP positive cells and tissues. Below: 20× confocal microscopy pictures showing EGFP in olfactory bulbs and tracts (A, dorsal view), pituitary (B, dorsal view), otic vesicle (C, lateral view), pectoral fin (D, dorsal view), liver (E, lateral view), pronephros (F, lateral view), putative KA′′ cells (G, lateral view) and dermal mesenchymal-like cells (H, lateral view). Bottom panel: schematic representation of a 5-dpf larva indicating the newly detectable EGFP-positive districts in addition to those already revealed at 2 dpf. Below: 20× confocal images showing fluorescence in the olfactory bulbs (I, dorsal view), heart (J, lateral view), pancreas (K, lateral view) and gut (L, lateral view). Scale bar: 200 µM. |
|
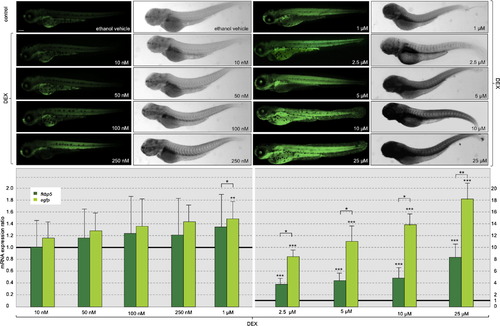
DEX-induced fluorescence in Tg(9×GCRE-HSV.Ul23:EGFP)ia20 zebrafish line is dose-dependent. Top panel: EGFP protein (on the left) and mRNA (on the right) distribution after treatment of transgenics with 10, 50, 100, 250 nM and 1, 2.5, 5, 10 and 25 µM DEX for 24 h as compared to their ethanol vehicle-treated siblings. Bottom panel: Fold changes in gene expression of fkbp5 and egfp, in 10, 50, 100, 250 nM and 1, 2.5, 5, 10 and 25 µM DEX-treated transgenics compared to controls (set at 1) with vehicle only. The expression levels of the target genes were normalized on ef1a as housekeeping gene. The experiment was repeated three times with 10 embryos for each treatment. Values represent the mean ± S.E. Asterisks indicate that expression levels are significantly different from the control: **P < 0.01, ***P < 0.001. Scale bar: 200 µM. EXPRESSION / LABELING:
|
|
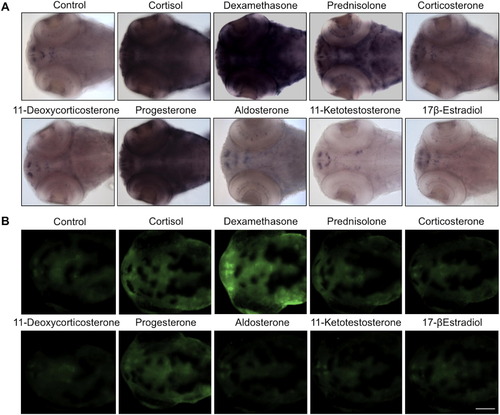
Transgenic line responses to different steroid treatments. (A) Light microscopy dorsal view and (B) fluorescence microscopy images of 3-dpf transgenic zebrafish treated for 48 h with the indicated compounds. In (A) responses were visualized by WMISH of egfp mRNA. Cortisol, dexamethasone, prednisolone, progesterone and corticosterone treatments increased reporter activity compared to control, while no changes were detectable with 11β-deoxycorticosterone (DOC), aldosterone, 11-ketotestosterone and 17β-estradiol (E2). Scale bar: 200 µM. EXPRESSION / LABELING:
|
|
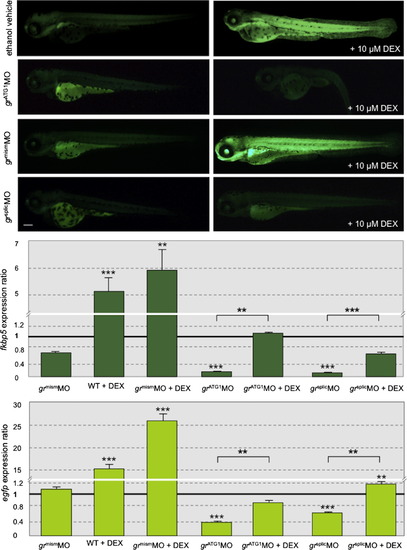
Reduced GRE activity following gr MOs injections alone or combined with 10 µM DEX treatment of 2-dpf transgenics for 24 h. Top panel: EGFP protein localization in control (ia20 embryos) and after translation-blocking MO (grATG1MO), missplicing MO (grsplicMO) and mismatched control MO (grmismMO) injections alone (on the left) or combined with DEX treatment (on the right). Middle and bottom panels: fold changes in gene expression of fkbp5 and egfp in embryos injected with grmismMO, grATG1MO and grsplicMO w/wo DEX treatment as compared to non- injected/non-treated control (set at 1). The expression levels of the target genes were normalized on ef1a as housekeeping gene. Values represent the mean ± S.E. Asterisks indicate expression levels that are significantly different from control (ia20 embryos) or between samples as indicated by the horizontal line: **P < 0.01; ***P < 0.001. Scale bar: 200 µM. EXPRESSION / LABELING:
|
|
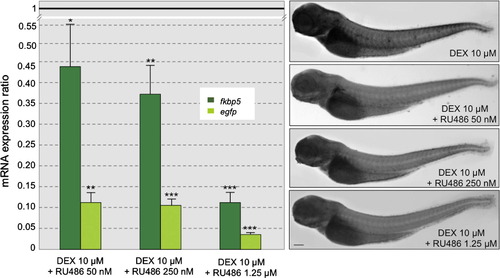
Reduced GRE activity following treatment with the GR antagonist RU486. Two-dpf transgenic embryos were treated for 24 h with 10 µM DEX alone or combined with three different RU486 concentrations (50, 250 and 1250 nM). Left panel: fold changes in gene expression of fkbp5 and egfp in treated embryos as compared to only DEX-treated control (set at 1). The expression levels of the target genes were normalized on ef1a as housekeeping gene. Values represent the mean ± S.E. Asterisks indicate expression levels that are significantly different from control (DEX-treated ia20): *P < 0.05; **P < 0.01; ***P < 0.001. Right panel: WMISH of egfp mRNA after DEX treatment alone or combined with RU486 at different concentrations. Scale bar: 200 µM. EXPRESSION / LABELING:
|
|
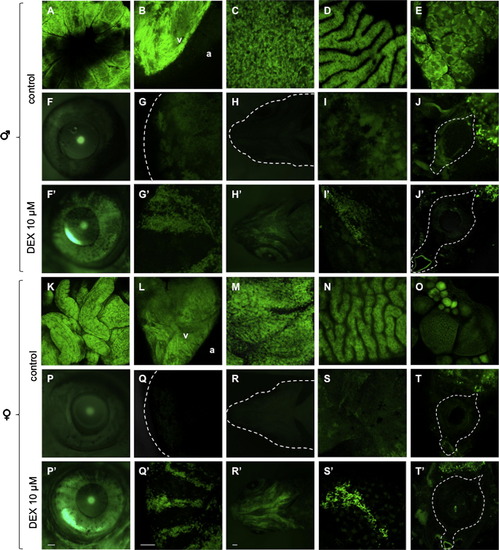
20× Confocal microscopy pictures showing EGFP in control and 10 µM DEX-treated adult zebrafish males and females: esophageal sacs (A and K), ventricular epicardium (B and L; v = ventricle; a = atrium), liver (C and M), intestinal mucosa (D and N), testis (E), ovary (O), eye (F and G, F′ and G′; P and Q, P′ and Q′), skeletal elements of the splanchnocranium (H′, R′), skin (I, I′, S, S′) and spinal cord (J, J′, T, T′). Scale bar: 200 µM. EXPRESSION / LABELING:
|
|
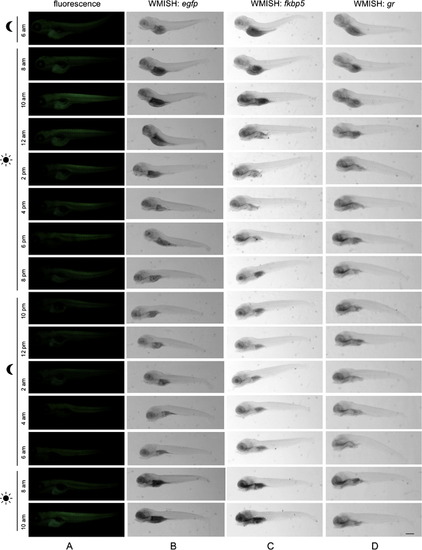
(A) Fluorescence microscopy lateral view, (B) WMISH of egfp mRNA of 5-dpf transgenic larvae and (C) WMISH of fkpb5 mRNA, (D) WMISH of gr mRNA of 5-dpf WT larvae exposed to standard photoperiodic regime and analyzed from 2 h before light onset for 28 h. Scale bar: 200 µM. |
|
A) Transgene expression (red) colocalizes, at 3 dpf, with otx5 transcripts (blu) in the pineal gland as shown by double WMISH. B) Transgene expression (red) colocalizes, at 2 dpf, with Fgf8 transcripts (blue) in the fin as shown by WMISH. C) Lateral section of egfp WMISH at 2 dpf showing putative KA′′ interneurons. D) Transgene expression (green) colocalizes at 2 dpf with Shh-reporter (red) expression in few KA′′ cells close to the floor plate as shown by confocal analysis of double transgenic embryos [Tg(9xGCRE-HSV.Ul23:EGFP)ia20 X Tg(12xGli-HSV.Ul23:nlsmCherry)ia10]. Scale bar: 200 µM. EXPRESSION / LABELING:
|
|
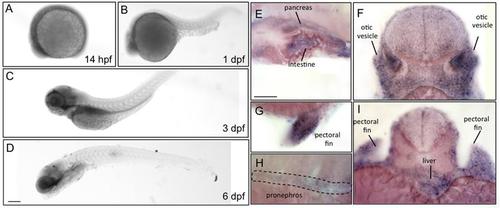
A-D) Light microscopy lateral views of zebrafish embryos and larvae at 14 hpf and 1, 3 and 6 dpf displaying gr mRNA localization during development. E-I) Details of gr positive structures of 2 dpf larvae embryos analysed by WMISH. Scale bar: 200 µM. EXPRESSION / LABELING:
|
Reprinted from Molecular and Cellular Endocrinology, 392(1-2), Benato, F., Colletti, E., Skobo, T., Moro, E., Colombo, L., Argenton, F., Dalla Valle, L., A living biosensor model to dynamically trace glucocorticoid transcriptional activity during development and adult life in zebrafish, 60-72, Copyright (2014) with permission from Elsevier. Full text @ Mol. Cell. Endocrinol.

