
Fig. 5
- ID
- ZDB-FIG-140908-5
- Publication
- Benato et al., 2014 - A living biosensor model to dynamically trace glucocorticoid transcriptional activity during development and adult life in zebrafish
- Other Figures
- All Figure Page
- Back to All Figure Page
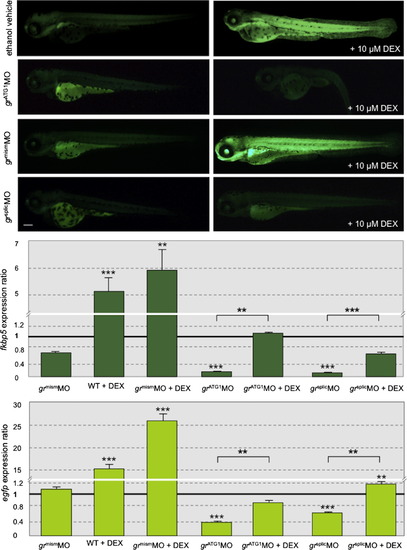
Reduced GRE activity following gr MOs injections alone or combined with 10 µM DEX treatment of 2-dpf transgenics for 24 h. Top panel: EGFP protein localization in control (ia20 embryos) and after translation-blocking MO (grATG1MO), missplicing MO (grsplicMO) and mismatched control MO (grmismMO) injections alone (on the left) or combined with DEX treatment (on the right). Middle and bottom panels: fold changes in gene expression of fkbp5 and egfp in embryos injected with grmismMO, grATG1MO and grsplicMO w/wo DEX treatment as compared to non- injected/non-treated control (set at 1). The expression levels of the target genes were normalized on ef1a as housekeeping gene. Values represent the mean ± S.E. Asterisks indicate expression levels that are significantly different from control (ia20 embryos) or between samples as indicated by the horizontal line: **P < 0.01; ***P < 0.001. Scale bar: 200 µM. |
| Gene: | |
|---|---|
| Fish: | |
| Condition: | |
| Knockdown Reagents: | |
| Anatomical Terms: | |
| Stage: | Protruding-mouth |
Reprinted from Molecular and Cellular Endocrinology, 392(1-2), Benato, F., Colletti, E., Skobo, T., Moro, E., Colombo, L., Argenton, F., Dalla Valle, L., A living biosensor model to dynamically trace glucocorticoid transcriptional activity during development and adult life in zebrafish, 60-72, Copyright (2014) with permission from Elsevier. Full text @ Mol. Cell. Endocrinol.