- Title
-
Hypoxia inducible factor signaling modulates susceptibility to mycobacterial infection via a nitric oxide dependent mechanism
- Authors
- Elks, P.M., Brizee, S., van der Vaart, M., Walmsley, S.R., van Eeden, F.J., Renshaw, S.A., and Meijer, A.H.
- Source
- Full text @ PLoS Pathog.
|
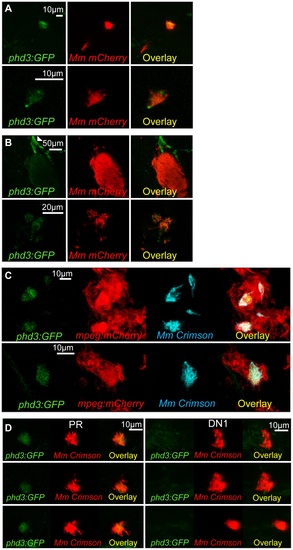
phd3 is expressed in infected macrophages during early stage Mm pathogenesis in a Hif-1α dependent manner. (A) Fluorescent confocal micrographs of 2 examples of infected areas prior to granuloma formation of 1 dpi embryos (upper and lower panels). phd3 expression was detected by GFP levels, in green, using the Tg(phd3:GFP)i144 transgenic line. Mm mCherry is shown in the red channel. Increased levels of phd3:GFP expression were detectable in cells associated with infection. (B) Fluorescent confocal micrographs of 2 granulomas at 6 dpi (upper and lower panels). Only low levels of phd3:GFP expression were detectable in areas of infection. The low level of GFP is illustrated in the upper panel where the auto-fluorescence of a pigment cell (white arrowhead) is brighter than the phd3:GFP expression. (C) Fluorescent confocal micrographs of 2 embryos with Mm infected macrophages at 1 dpi. The phd3:GFP line was outcrossed to the mpeg1:mCherry line to show co-localization with infected macrophages. (D) phd3:GFP embryos were injected at the 1 cell stage with dominant negative hif-1αb RNA (DN1) or phenol red (PR) as a negative control. 60 embryos of each were screened for phd3:GFP expression using confocal microscopy and the 3 brightest areas of phd3:GFP expression were imaged and showed co-localization with Mm infection. In the DN1 group GFP laser levels and confocal settings were increased until background green fluorescence was visible showing no specific co-localisation with Mm. |
|
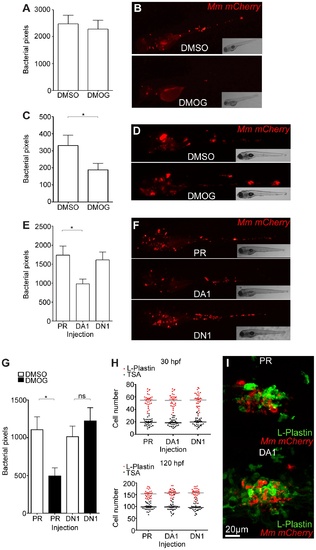
Stabilization of Hif-1α at early stages of infection leads to a decrease in bacterial burden. (A) Quantification of bacterial burden by fluorescent pixel count after DMOG treatment between 5 and 6 dpi. No significant difference was observed between groups. Data shown are mean ± SEM, n = 106–121 accumulated from 3 independent experiments. (B) Stereo-fluorescence micrographs of Mm mCherry infected 6 dpi larvae from (C). (C) Bacterial pixel counts of larvae treated with DMOG between -4 and 24 hpi, imaged at 4 dpi. DMOG treated embryos have significantly lower levels of bacterial burden. Data shown are mean ± SEM, n = 109–114 accumulated from 3 independent experiments. *P<.05, **P<.01, and ***P<.001. (D) Fluorescence micrographs of representative infected larvae for data shown in (E). (E) Bacterial pixel counts of RNA injected larvae at 4 dpi. Dominant active hif-1αb (DA1) significantly decreased bacterial burden in infected larvae compared to both phenol red injected controls (PR) and dominant negative hif-1αb (DN1). Data shown are mean ± SEM, n = 115–127 as accumulated from 3 independent experiments. (F) Example fluorescence micrographs from the data found in (E). (G) Bacterial pixel counts of RNA injected larvae at 4 dpi after DMSO/DMOG treatment for 24 hours at 4 hours before Mm injection. Dominant negative hif-1αb was able to block the antimicrobial effect of DMOG treatment. Data shown are mean ± SEM, n = 83–100 as accumulated from 3 independent experiments. (H, upper panel) L-plastin (macrophages and neutrophils) and TSA (neutrophils only) wholebody counts at 30 hpf. No significant difference was observed between groups. Data shown are mean ± SEM, n = 90 accumulated from 3 independent experiments. (H, lower panel) L-plastin and TSA wholebody counts at 120 hpf. Data shown are mean ± SEM, n = 90 as accumulated from 3 independent experiments. (I) Example fluorescence confocal micrographs of 4 dpi granuloma structures from phenol red (PR) and dominant active hif-1αb (DA1) injected larvae. Leukocytes are identified by Alexa-488 (green) labeled L-plastin antibody. EXPRESSION / LABELING:
|
|
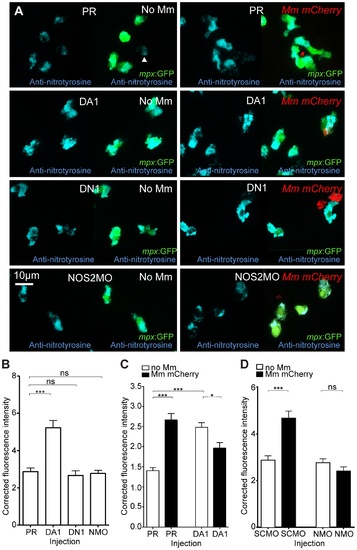
Nitrosylation levels are increased in unchallenged leukocytes with stabilized Hif-1α. (A) Example fluorescence confocal z-stacks of the caudal vein region of embryos stained with Alexa-633 labeled anti-nitrotyrosine antibody (blue), imaged at 1 dpi in the presence or absence of Mm infection. Embryos were injected with phenol red (PR), dominant active hif-1αb (DA1), dominant negative hif-1αb (DN1), or nos2a morpholino (NOS2MO). Anti-nitrotyrosine mainly co-localized with neutrophils (labeled with mpx:GFP), however, some cells without GFP (white arrowhead), possibly macrophages, were also labeled. (B) Corrected fluorescence intensity levels of anti-nitrotyrosine antibody confocal z-stacks in uninfected larvae at 2 dpf (1 dpi equivalent). Dominant active hif-1αb (DA1) had significantly increased anti-nitrotyrosine levels in the absence of Mm bacterial challenge compared to phenol red (PR) injected controls. Data shown are mean ± SEM, n = 67–92 cells accumulated from 5 embryos per group. Graph shown is a representative dataset of 3 independent experiments. (C) Corrected fluorescence intensity levels of anti-nitrotyrosine antibody confocal z-stacks of dominant active hif-1αb (DA1), or phenol red (PR) control injected embryos in the presence or absence of Mm infection at 1 dpi. Data shown are mean ± SEM, n = 233–270 cells accumulated from 15 embryos. Graph shown is combined data from 3×5 embryos from independent experiments. (D) Corrected fluorescence intensity levels of anti-nitrotyrosine antibody confocal z-stacks of nos2a morpholino (NMO) or standard control morpholino (SCMO) injected embryos imaged at 1 dpi (2 dpf) in the presence or absence of Mm. Data shown are mean ± SEM, n = 46–92 cells accumulated from 5 embryos. Graph shown is a representative dataset of 3 independent experiments. |
|
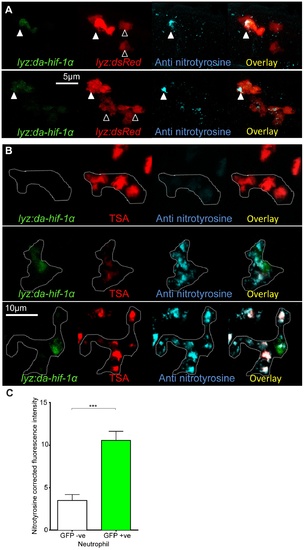
Neutrophil-specific stabilization of Hif-1α causes increased neutrophil nitrosylation. (A) Confocal photomicrographs of expression of lyz driven DA hif-1αb and IRES- nlseGFP (lyz:da-hif-1α) in lyz:dsRed embryos stained with anti-nitrotyrosine antibody at 2 dpf. Cells with nuclear localized eGFP colocalized with lyz:dsRed expression showing neutrophil specificity of the transgenic construct. Mosaic labeled neutrophils (white arrowheads) had a higher level of anti nitrotyrosine signal compared to GFP negative ones (black arrowheads). (B) Confocal photomicrographs of a Tg(lyz:da-hif-1αb:IRES-nlsegfp) (lyz:da-hif-1α) injected ABTL embryo at 2 dpf. TSA staining of endogenous myeloperoxidase was used to stain neutrophils. Due to the nature of the myeloperoxidase staining, the whole cell is not marked, so the cell boundaries have been traced (dotted line) using brightfield z-stacks. The upper panel shows an example of a lyz:da-hif-1α negative neutrophil with low levels of anti-nitrotyrosine. The lower panels show two examples of lyz:da-hif-1α positive neutrophils in the same embryo, exhibiting a greater level of anti-nitrotyrosine compared to the negative neutrophils. (C) Corrected fluorescence intensity levels of anti-nitrotyrosine antibody confocal z-stacks of GFP negative or positive neutrophils in embryos transiently expressing Tg(lyz:da-hif-1αb:IRES-nlsegfp). Embryos were imaged at 2 dpf. For each GFP positive neutrophil observed, a neighboring GFP negative neutrophil was also imaged. Data shown are mean ± SEM, n = 20 cells per group accumulated from 13 embryos from 4 independent experiments. P values were calculated using a paired T-test. |
|
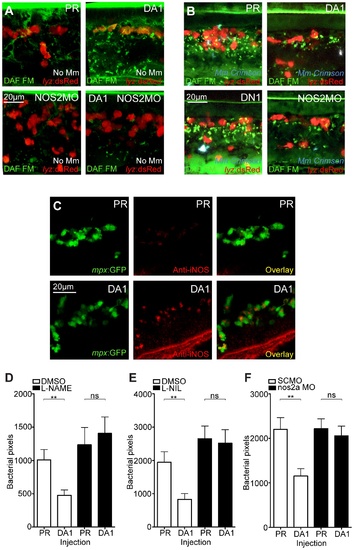
Hif-1α mediated anti-mycobacterial effect is iNOS dependent. (A) Fluorescent confocal micrographs of DAF-FM DA stained embryos at 2 dpf in the absence of infection. Neutrophils are identified by lyz:dsRed expression. DAF-FM DA staining between the timepoint of infection and 1 dpi produced varying levels of background and stained cells of the central nervous system (neurons and notochord) as well as having leukocyte-associated staining. The line of staining at the top of each image is DAF-FM DA staining in the notochord. Punctae of DAF-FM DA show upregulation of NO signaling Dominant active hif-1αb (DA1) embryos had more punctae than phenol red (PR) controls. nos2a morpholino (NOS2MO) reduced the punctae in both the PR and DA1 background. (B) Fluorescent confocal micrographs of DAF-FM DA stained embryos at 2 dpf in the presence of Mm infection. In phenol red (PR) controls DAF-FM DA punctae are increased. DAF-FM DA staining is not specific for iNOS (it is a pan-NOS probe), and the nos2a morpholino (NOS2MO) was not able to downregulate all of the DAF-FM DA staining after Mm infection, although punctae number were reduced. The number of punctae was also reduced in the dominant active hif-1αb (DA1) injected embryos after Mm infection. Dominant negative hif-1αb (DN1) caused no change in punctae in the presence of Mm infection compared to PR controls. (C) Fluorescent confocal micrographs of iNOS antibody staining in mpx:GFP embryos. Phenol red (PR) injected controls had very low levels of anti-iNOS antibody staining. Dominant active hif-1αb (DA1) had increased levels of anti-iNOS antibody, a stain which was mainly neutrophil specific. (D) Bacterial burden at 4 dpi after injection of DA hif-1αb (DA1) or phenol red control (PR) and treatment with the pan-NOS inhibitor L-NAME. Data shown are mean ± SEM, n = 62–89 as accumulated from 3 independent experiments. (E) Bacterial burden at 4 dpi after injection of DA hif-1αb (DA1) and treatment with the iNOS inhibitor L-NIL. Data shown are mean ± SEM, n = 60–87 as accumulated from 3 independent experiments. (F) Bacterial burden at 4 dpi after co-injection of DA hif-1αb and the nos2a morpholino, using the standard control (SCMO) morpholino as a negative control. Data shown are mean ± SEM, n = 109–116 as accumulated from 4 independent experiments. |
|
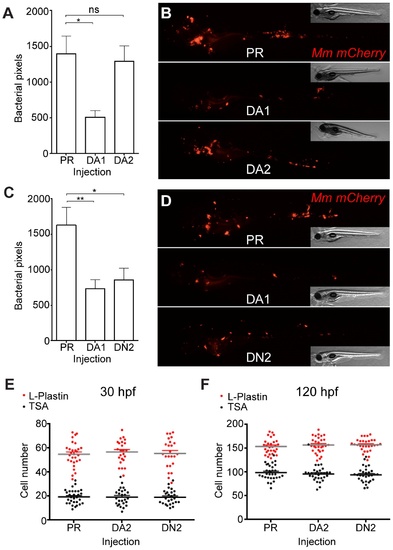
Hif-2α has opposing effects on bacterial burden than Hif-1α. (A) Bacterial pixel counts of dominant active hif-2αb (DA2) bacterial burden levels in 4 dpi infected embryos compared to phenol red (PR) and dominant active hif-1αb (DA1) injected controls. Data shown are mean ± SEM, n = 52–79 as accumulated from 3 independent experiments. (B) Example fluorescence micrographs of the data shown in (A). (C) Bacterial pixel counts of dominant negative hif-2αa (DN2) bacterial burden levels in 4 dpi infected embryos compared to phenol red (PR) and dominant active hif-1αb (DA1) injected controls. Data shown are mean ± SEM, n = 74–82 performed as 3 independent experiments. (D) Example fluorescence micrographs of the data shown in (C). (E) L-plastin (macrophages and neutrophils) and TSA (neutrophils only) wholebody counts at 30 hpf after injection of dominant active (DA2) and dominant negative (DN2) hif-2αa RNA. No significant difference was observed between groups. Data shown are mean ± SEM, n = 77–82 as accumulated from 3 independent experiments. (F) L-plastin and TSA wholebody counts at 120 hpf after injection of dominant active (DA2) and dominant negative (DN2) hif-2αa RNA. Data shown are mean ± SEM, n = 87–90 as accumulated from 3 independent experiments. |

Dominant negative Hif-2α decreases bacterial burden via an iNOS dependent mechanism. (A) Example fluorescence confocal z-stacks of the caudal vein region of embryos stained with anti-nitrotyrosine antibody, imaged at 1 dpi (2 dpf), in the absence and presence of Mm infection. Embryos were injected with dominant negative hif-2αa (DN2), dominant active hif-2&aklpha;a (DA2), or phenol red (PR). (B) Corrected fluorescence intensity levels of anti-nitrotyrosine antibody confocal z-stacks in uninfected larvae. Dominant negative hif-2αa (DN2) had significantly increased anti-nitrotyrosine levels in the absence of Mm bacterial challenge compared to phenol red (PR) injected controls. Data shown are mean ± SEM, n = 42–92 cells accumulated from 5 embryos. Graph shown is a representative dataset of 3 independent experiments. (C) Corrected fluorescence intensity levels of anti-nitrotyrosine antibody confocal z-stacks of dominant active hif-2αa (DA2), or phenol red (PR) control injected embryos in the presence or absence of Mm infection at 1 dpi (2 dpf). Data shown are mean ± SEM, n = 46–92 cells accumulated from 5 embryos. Graph shown is a representative dataset of 3 independent experiments. (D) Bacterial burden at 4 dpi after injection of dominant negative hif-2αa (DN2) or phenol red control (PR) and treatment with the pan-NOS inhibitor L-NAME. Data shown are mean ± SEM, n = 67–85 as accumulated from 3 independent experiments. (E) Bacterial burden at 4 dpi after injection of dominant negative hif-2αa (DN2) and treatment with the iNOS inhibitor L-NIL. Data shown are mean ± SEM, n = 52–58 as accumulated from 3 independent experiments. (F) Bacterial burden at 4 dpi after co-injection of dominant negative hif-2αa (DN2) and the nos2a morpholino, using the standard control (SC) morpholino as a negative control. Data shown are mean ± SEM, n = 103–109 as accumulated from 4 independent experiments. (G) Schematic of the effect of early Hif-α modulation during early Mm infection. |
|
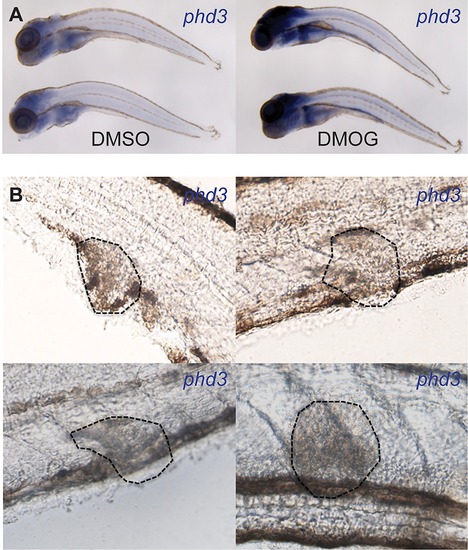
Later stage larval infection showed no detectable levels of Hif-1α signaling. (A) In situ hybridization using a phd-3 antisense probe indicated no detectable expression in granulomas in 6 dpi zebrafish larvae. Lower panels show larvae treated with DMOG that have upregulated expression of phd3 indicating that the in situ detection of phd3 is functional and dependent on activated Hif-α signaling. (B) Micrographs of 4 individual granulomas (encircled with dotted lines) of 6 dpi larvae taken with DIC light microscopy. Hif-α signaling is labeled in the larvae by phd3 in situ hybridization, however, no levels of expression were detectable in granulomas. |
|
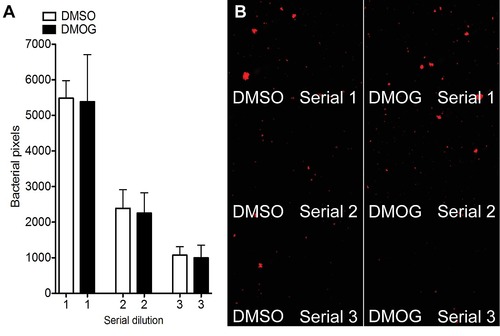
DMOG did not affect MM bacterial growth in vitro. (A) Bacterial pixel count of plated out serial dilutions of Mm liquid cultures after overnight incubation in DMSO/DMOG. The bacterial culture was split into two after inoculation and treated with 100 μM DMOG, or DMSO. After treatment and growth overnight, serial dilutions of the liquid culture were plated out and grown for 4 days before imaging. Data shown are mean ± SEM, n = 15 as accumulated from 3 independent experiments. (B) Example fluorescence photomicrographs from the data shown in (A). |
|
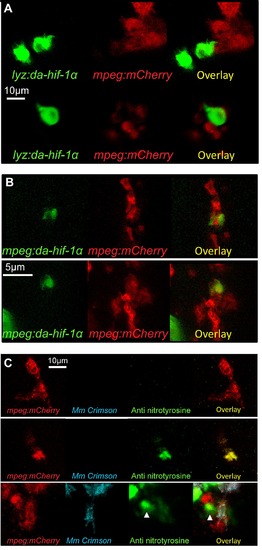
Leukocyte cell-type specific expression of stabilized Hif-1α and macrophage labeling with anti-nitrotyrosine. (A) Confocal photomicrographs of Tg(lyz:da-hif-1αb:ires-nlsegfp) (lyz:da-hif-1α) injected mpeg1:mCherry embryos at 2 dpf. IRES-nlsGFP is expressed in cells in the caudal haematopoetic tissue associated with leukocytes and mpeg1 positive macrophages, but is not present within the same cell. (B) Confocal photomicrographs of Tg(mpeg1:da-hif-1αb:ires-nlsegfp) (mpeg:da-hif-1α) injected Tg(mpeg1:mCherryF)ump2 line (mpeg:mCherry) at 2 dpf. IRES-nlsGFP is found expressed in the same cells as mpeg:mCherry indicating macrophage expression. (C) Confocal micrographs showing anti nitrotyrosine staining in macrophages in the mpeg:mCherry at 2 dpf. Upper panels show a nitrotyrosine negative macrophage, which is representative of the majority of the macrophage population. Middle panels show a nitrotyrosine positive macrophage in the absence of infection. Lower panels show a nitrotyrosine positive macrophage in the presence of infection. In both the absence and presence of infection nitrotyrosine positive macrophages are a rare event (approximately <5% of the population). |
|
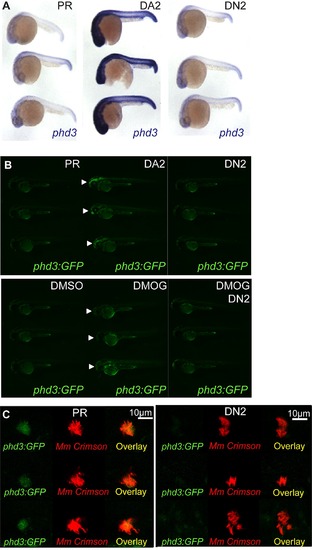
Dominant hif-2αa variants exhibit the same effects on phd3 expression as the equivalent dominant hif-1αb variants. (A) Photomicrographs of 24 hpf embryos after injection with dominant active (DA2) and dominant negative (DN2) hif-2αa constructs or phenol red (PR) as a control, showing expression of the Hif-α target gene phd3 by in situ hybridization. (B) Fluorescent photomicrographs of 48 hpf phd3:GFP embryos injected with dominant active with dominant active (DA2) and dominant negative (DN2) hif-2αa constructs or phenol red (PR) as a control. Upper panels show that DA2 increases the expression of phd3:GFP compared to PR and DN2 (white arrows). Lower panels show that DN2 can block the increased expression of phd3:GFP in the yolk (white arrows) after DMOG treatment. (C) phd3:GFP embryos were injected at the 1 cell stage with dominant negative hif-2αa RNA (DN2) or phenol red (PR) as a negative control. 60 embryos of each were screened for phd3:GFP expression using confocal microscopy and the 3 brightest areas of phd3:GFP expression were imaged and showed co-localization Mm infection. In the DN2 group GFP laser levels and confocal settings were increased until background green fluorescence was visible showing no specific co-localisation with Mm. |

