
Fig. 6
- ID
- ZDB-IMAGE-140416-36
- Publication
- Elks et al., 2013 - Hypoxia inducible factor signaling modulates susceptibility to mycobacterial infection via a nitric oxide dependent mechanism
- All Figures
- Figures for Elks et al., 2013
|
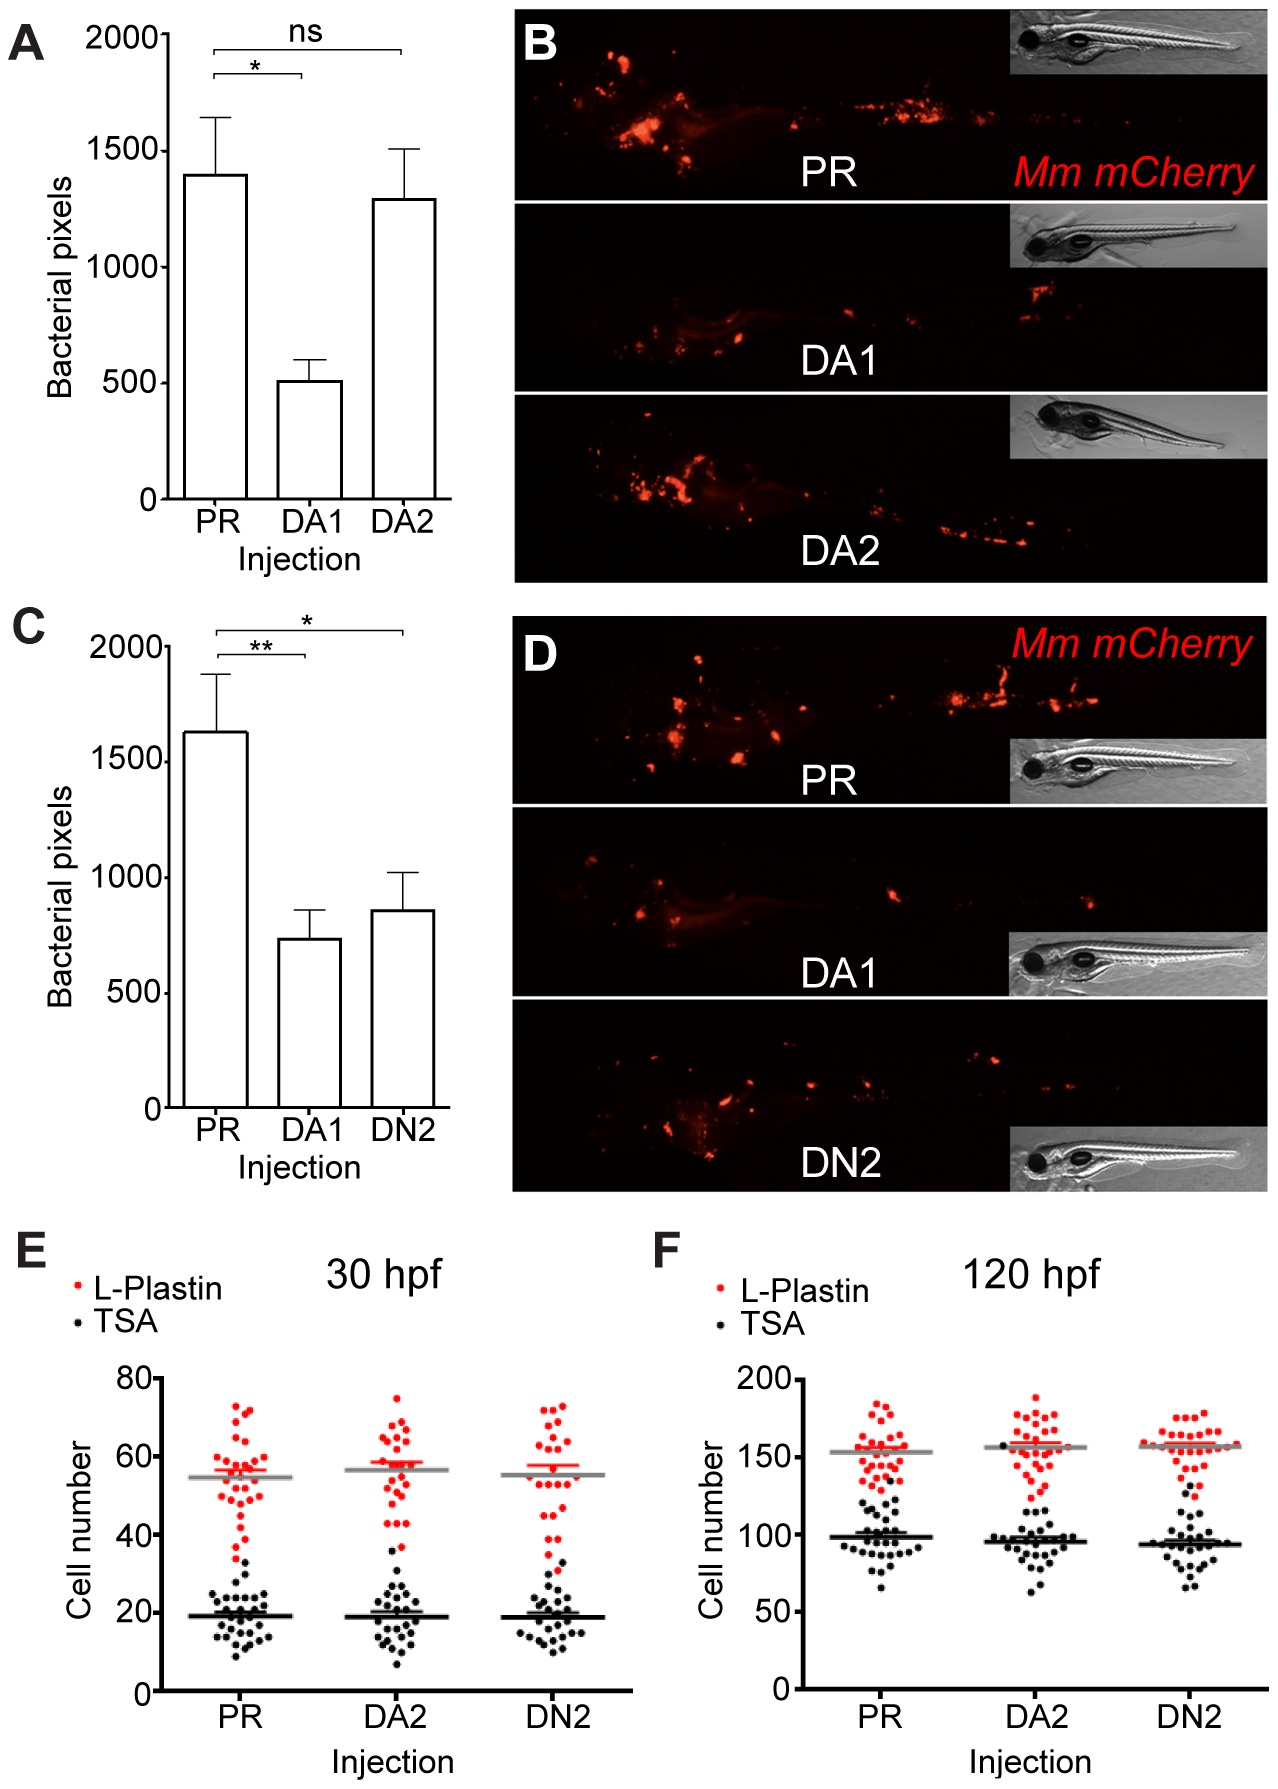
Fig. 6
Hif-2α has opposing effects on bacterial burden than Hif-1α.
(A) Bacterial pixel counts of dominant active hif-2αb (DA2) bacterial burden levels in 4 dpi infected embryos compared to phenol red (PR) and dominant active hif-1αb (DA1) injected controls. Data shown are mean ± SEM, n = 52–79 as accumulated from 3 independent experiments. (B) Example fluorescence micrographs of the data shown in (A). (C) Bacterial pixel counts of dominant negative hif-2αa (DN2) bacterial burden levels in 4 dpi infected embryos compared to phenol red (PR) and dominant active hif-1αb (DA1) injected controls. Data shown are mean ± SEM, n = 74–82 performed as 3 independent experiments. (D) Example fluorescence micrographs of the data shown in (C). (E) L-plastin (macrophages and neutrophils) and TSA (neutrophils only) wholebody counts at 30 hpf after injection of dominant active (DA2) and dominant negative (DN2) hif-2αa RNA. No significant difference was observed between groups. Data shown are mean ± SEM, n = 77–82 as accumulated from 3 independent experiments. (F) L-plastin and TSA wholebody counts at 120 hpf after injection of dominant active (DA2) and dominant negative (DN2) hif-2αa RNA. Data shown are mean ± SEM, n = 87–90 as accumulated from 3 independent experiments.