
Fig. 4
- ID
- ZDB-IMAGE-140416-31
- Publication
- Elks et al., 2013 - Hypoxia inducible factor signaling modulates susceptibility to mycobacterial infection via a nitric oxide dependent mechanism
- All Figures
- Figures for Elks et al., 2013
|
Fig. 4
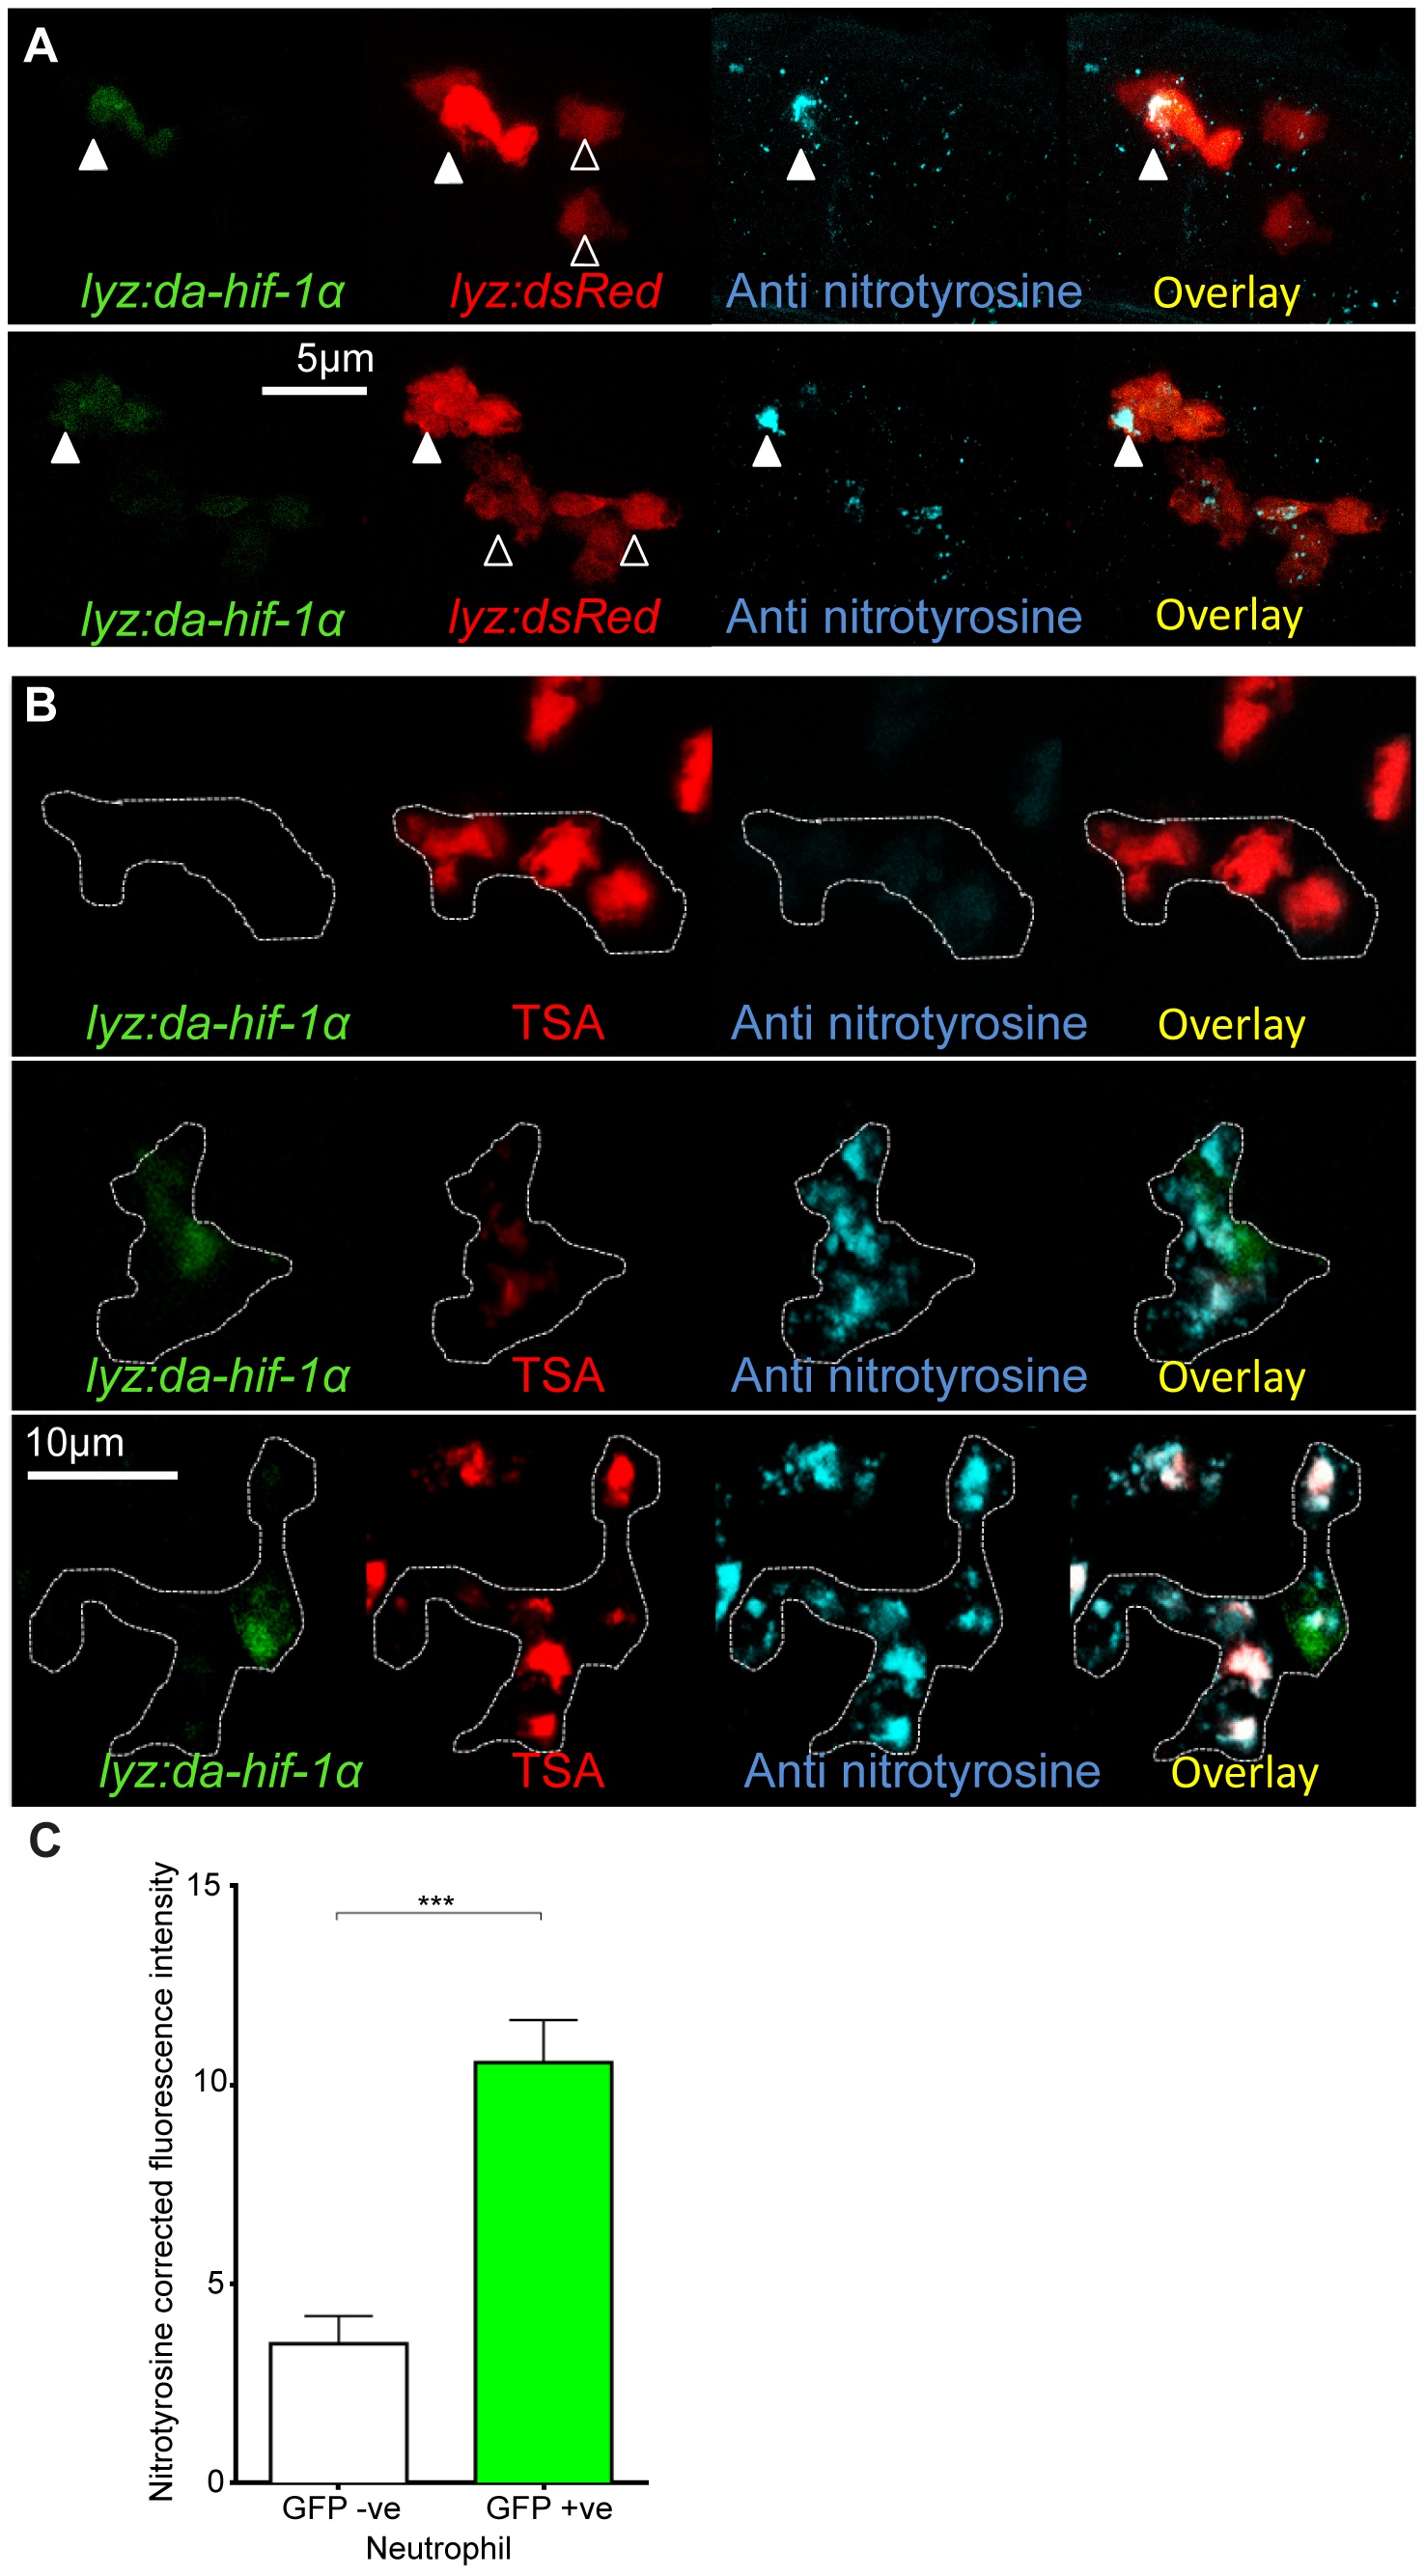
Neutrophil-specific stabilization of Hif-1α causes increased neutrophil nitrosylation.
(A) Confocal photomicrographs of expression of lyz driven DA hif-1αb and IRES- nlseGFP (lyz:da-hif-1α) in lyz:dsRed embryos stained with anti-nitrotyrosine antibody at 2 dpf. Cells with nuclear localized eGFP colocalized with lyz:dsRed expression showing neutrophil specificity of the transgenic construct. Mosaic labeled neutrophils (white arrowheads) had a higher level of anti nitrotyrosine signal compared to GFP negative ones (black arrowheads). (B) Confocal photomicrographs of a Tg(lyz:da-hif-1αb:IRES-nlsegfp) (lyz:da-hif-1α) injected ABTL embryo at 2 dpf. TSA staining of endogenous myeloperoxidase was used to stain neutrophils. Due to the nature of the myeloperoxidase staining, the whole cell is not marked, so the cell boundaries have been traced (dotted line) using brightfield z-stacks. The upper panel shows an example of a lyz:da-hif-1α negative neutrophil with low levels of anti-nitrotyrosine. The lower panels show two examples of lyz:da-hif-1α positive neutrophils in the same embryo, exhibiting a greater level of anti-nitrotyrosine compared to the negative neutrophils. (C) Corrected fluorescence intensity levels of anti-nitrotyrosine antibody confocal z-stacks of GFP negative or positive neutrophils in embryos transiently expressing Tg(lyz:da-hif-1αb:IRES-nlsegfp). Embryos were imaged at 2 dpf. For each GFP positive neutrophil observed, a neighboring GFP negative neutrophil was also imaged. Data shown are mean ± SEM, n = 20 cells per group accumulated from 13 embryos from 4 independent experiments. P values were calculated using a paired T-test.