
Fig. 2
- ID
- ZDB-FIG-140416-32
- Publication
- Elks et al., 2013 - Hypoxia inducible factor signaling modulates susceptibility to mycobacterial infection via a nitric oxide dependent mechanism
- Other Figures
- All Figure Page
- Back to All Figure Page
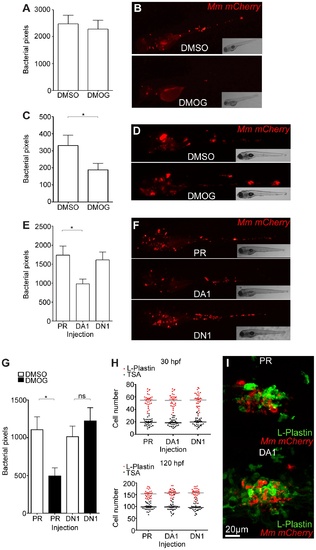
Stabilization of Hif-1α at early stages of infection leads to a decrease in bacterial burden. (A) Quantification of bacterial burden by fluorescent pixel count after DMOG treatment between 5 and 6 dpi. No significant difference was observed between groups. Data shown are mean ± SEM, n = 106–121 accumulated from 3 independent experiments. (B) Stereo-fluorescence micrographs of Mm mCherry infected 6 dpi larvae from (C). (C) Bacterial pixel counts of larvae treated with DMOG between -4 and 24 hpi, imaged at 4 dpi. DMOG treated embryos have significantly lower levels of bacterial burden. Data shown are mean ± SEM, n = 109–114 accumulated from 3 independent experiments. *P<.05, **P<.01, and ***P<.001. (D) Fluorescence micrographs of representative infected larvae for data shown in (E). (E) Bacterial pixel counts of RNA injected larvae at 4 dpi. Dominant active hif-1αb (DA1) significantly decreased bacterial burden in infected larvae compared to both phenol red injected controls (PR) and dominant negative hif-1αb (DN1). Data shown are mean ± SEM, n = 115–127 as accumulated from 3 independent experiments. (F) Example fluorescence micrographs from the data found in (E). (G) Bacterial pixel counts of RNA injected larvae at 4 dpi after DMSO/DMOG treatment for 24 hours at 4 hours before Mm injection. Dominant negative hif-1αb was able to block the antimicrobial effect of DMOG treatment. Data shown are mean ± SEM, n = 83–100 as accumulated from 3 independent experiments. (H, upper panel) L-plastin (macrophages and neutrophils) and TSA (neutrophils only) wholebody counts at 30 hpf. No significant difference was observed between groups. Data shown are mean ± SEM, n = 90 accumulated from 3 independent experiments. (H, lower panel) L-plastin and TSA wholebody counts at 120 hpf. Data shown are mean ± SEM, n = 90 as accumulated from 3 independent experiments. (I) Example fluorescence confocal micrographs of 4 dpi granuloma structures from phenol red (PR) and dominant active hif-1αb (DA1) injected larvae. Leukocytes are identified by Alexa-488 (green) labeled L-plastin antibody. |
| Antibody: | |
|---|---|
| Fish: | |
| Condition: | |
| Anatomical Terms: | |
| Stage: | Day 5 |