
- Title
-
Loss of fibrinogen in zebrafish results in symptoms consistent with human hypofibrinogenemia
- Authors
- Vo, A.H., Swaroop, A., Liu, Y., Norris, Z.G., and Shavit, J.A.
- Source
- Full text @ PLoS One

In situ hybridization of zebrafish fibrinogen genes demonstrates liver and yolk sac specific expression. Whole mount in situ hybridization was performed using antisense mRNA probes complementary to the fga, fgb, and fgg mRNAs (a, b, and c respectively) at 5 dpf. The expression patterns were identical, with high levels in the liver and yolk sac. Individual experiments showed variability in yolk sac expression for all 3 genes, e.g. lower (a, b) and higher (c) levels of expression. Sections through fgb probed larvae confirmed that liver expression was in hepatocytes, while the yolk sac staining was in the outer cellular layer (d–f). Arrowheads indicate the liver, while arrows point to the yolk sac; yg, yolk granules. Sections of fga and fgg probed larvae demonstrated the same pattern, while in situ hybridization with probes generated from the sense strand did not show any signal (not shown). EXPRESSION / LABELING:
|
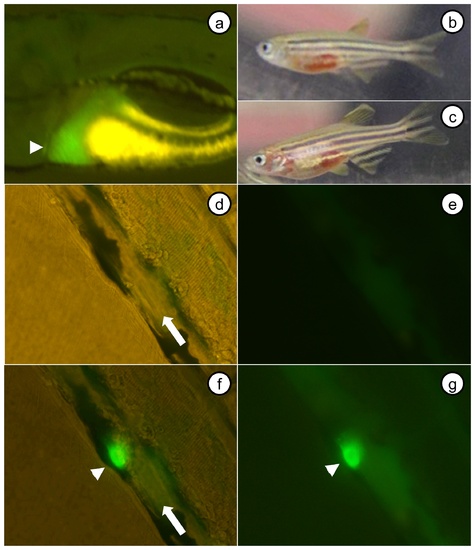
Liver specific expression of fgb-egfp results in incorporation of fusion protein into an induced thrombus. A fabp10-fgb-egfp transgenic line of zebrafish was produced, and F1 offspring analyzed. (a) Expression was liver specific, as demonstrated by the region of green fluorescence in a 5 dpf larva (yellow signal is yolk sac autofluorescence). (b, c) F1 adult fish displayed overt hemorrhage, suggestive of potential interference with coagulation secondary to dysfibrinogenemia. Pictures of the PCV prior to (d, brightfield+fluorescence; e, fluorescence only), and after (f, brightfield+fluorescence; g, fluorescence only) laser injury (f, g were prior to complete occlusion). The arrowhead in a indicates liver, arrows in d, f indicate PCV and direction of flow, and arrowheads in f, g point to the induced thrombus. |
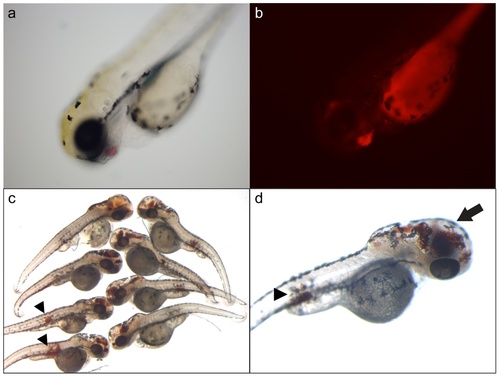
Morpholino knockdown of fga, fgb, and fgg results in intracranial and intramuscular hemorrhage. Single cell embryos were injected with 1fga, fgb, and fgg splice blocking MOs, and analyzed at 3 dpf. Larvae displayed what appeared to be hemorrhage, primarily intracranial, which was confirmed by two methods. (a) Example of an injected gata1-dsred transgenic larva with apparent hemorrhage in the facial region, confirmed under fluorescence (b). Note that the yolk sac displays autofluorescence. o-dianisidine staining detects hemoglobin, which identified sites of hemorrhage (c, d). These sites included intracranial hemorrhage with secondary hydrocephalus (arrow in d), as well as apparent intramuscular hemorrhage (arrowheads in c, d). EXPRESSION / LABELING:
PHENOTYPE:
|
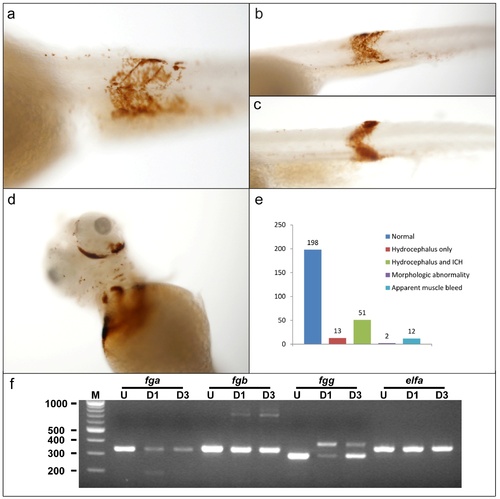
Additional sites of hemorrhage in fibrinogen morphants. Other sites of hemorrhage were visible in morpholino-injected larvae. Single cell embryos were injected with 1 nl of a mixture containing a final concentration of 0.5 mM of each of fga, fgb, and fgg splice blocking MOs, and then analyzed at 3 dpf by o-dianisidine staining. (a–c) Examples of morphants with intramuscular hemorrhage. Arrow shaped muscle segments are clearly highlighted by o-dianisidine staining, indicating hemorrhage. (d) Example of orbital hemorrhage. (e) Larvae were evaluated under a low power dissecting microscope and scored in the categories described. The 12 larvae with apparent muscle bleeds (as shown in a–c) also had hydrocephalus with or without ICH (intracranial hemorrhage). Control larvae displayed no abnormalities. (f) RT-PCR analysis of larvae after MO injection. Total mRNA was prepared from pools of 10 embryos or larvae that were uninjected (U), 1 day post injection (D1), or 3 days post injection (D3). RT-PCR was performed using primers in exons flanking the target splice donor sites. The quantity of parental cDNA product was diminished after injection, and altered splicing lead to additional products that were reduced (fga) or increased (fgb and fgg) in size, consistent with MO knockdown. elfa (elongation factor I alpha) was included as control for mRNA integrity. M, molecular weight marker with sizes in base pairs. PHENOTYPE:
|