
- Title
-
Characterization of na(+) and ca(2+) channels in zebrafish dorsal root ganglion neurons
- Authors
- Won, Y.J., Ono, F., and Ikeda, S.R.
- Source
- Full text @ PLoS One
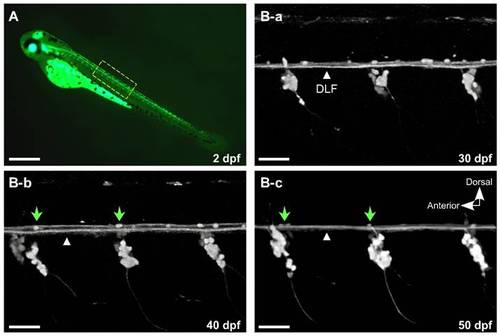
EGFP expression driven by the Isl2b promoter facilitates observation of dorsal root ganglia development concurrent with degeneration of Rohon-Beard (R-B) neurons. A, At 2 days post-fertilization (dpf), EGFP was intensely expressed in R-B and DRG neurons. B-a–c, Higher magnification confocal images of the spinal cord in isl2b:EGFP at 30, 40 and 50 dpf. A few EGFP-labeled cells remained over the dorsal longitudinal fasciculus (DFL, white triangles) that progressively decreased until only ~1–3 cells/field remained (B-b and c, green arrow heads). All images are maximum intensity projections of z-stacks acquired in the lateral plane using confocal microscopy. The contrast of the images was adjusted to emphasize EGFP-labeled sensory neurons. Scale bar in A represents 0.5 mm and the other scale bars represent 50 μm. |
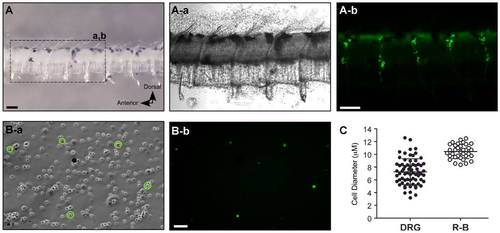
Isolation of single DRG neurons from isl2b:EGFP transgenic zebrafish. A, Dissected central trunk region including the spinal cord and notochord from juvenile isl2b:EGFP fish (left panel). Enlarged dashed region shows EGFP-labeled DRG present in every trunk segment from the primary preparation (A-a and b). Note that the trunk segment had been exposed to enzymes at this point. B, Phase-contrast (B-a) and fluorescent (B-b) photomicrographs of acutely dissociated DRG neurons (circled) from the primary preparation. Scale bar in A (top) represent 0.1 mm and scale bar in B (bottom) represent 50 μm. C, Dot plots representing cell diameter of single dissociated DRG (filled circles) and R-B (open circles) neurons. Error bars represent standard deviation and statistical significant was determined using an unpaired t-test with Welch′s correction. |
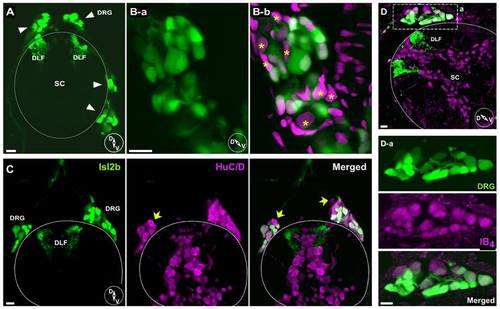
Immunohistochemistry of DRG neurons in juvenile isl2b:EGFP fish sections. A, Confocal image displaying EGFP-labeled DRG neurons and DFL in transverse section. Note that both dorsal and ventrolateral positioned DRG (arrows) cell bodies were observed. B, Higher magnification images of DRG ganglion reveal a variety of cell body sizes (B-a). Counterstaining with DAPI (B-b, magenta) revealed that some EGFP-negative or dim cell bodies were also present in DRG sections (asterisks). C, EGFP-positive and -negative DRG neurons from juvenile isl2b:EGFP fish. A few DRG neurons stained with anti-HuC/HuD neuronal protein antibody (magenta) did not express EGFP. D, Isolectin B4 (IB4) staining. Most DRG cell bodies and some spinal neurons were labeled with IB4 (magenta). Dashed rectangular region was enlarged for displaying labeled DRG neurons (D-a). Solid line represents the dorsal boundary of the spinal cord. Inset cartoons represent orientation of images. D, dorsal; V, ventral; SC, spinal cord; DFL, dorsal longitudinal fasciculus. All scale bars represent 10 μm. |
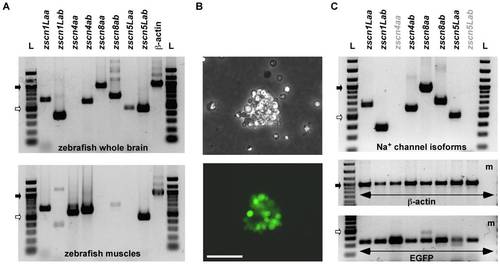
RT-PCR analysis of mRNA encoding Na+ channels from zebrafish DRG. A, Upper and lower electrophoresis images show RT-PCR products generated from specific primer sets coding for Na+ channel isoforms (zscn1Laa/ab, zscn4aa/ab, zscn8aa/ab and zscn5Laa/ab) from zebrafish whole brain and muscles, respectively. B, Phase-contrast (upper) and fluorescent (bottom) images of an example dissociated a DRG cluster as was used for RT-PCR. Scale bar represent 50 &mum. C, RT-PCR products generated from a DRG cluster. PCR products of each lane represent they were generated from same RT reaction tube. Zscn primer sets were used in the same order as arranged in Fig. 6A. PCR was also performed with β-actin as well as EGFP primer sets to establish successful DRG neurons isolation. The resultant PCR products were separated and visualized on 1.5% agarose gel. L: DNA ladder, m: culture media, Filled and opened arrows represent 1 Kbp and 0.5 Kbp size markers, respectively. |
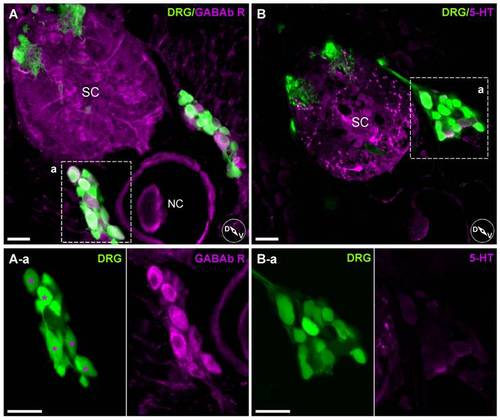
Heterogeneous expression pattern of anti-GABAb receptor antibody staining on DRG neurons. A, Labeling with an anti-GABAb R1 antibody. Enlarged images (A-a, left and right) show only a specific subset of DRG neurons were labeled (asterisks). B, Labeling with an antibody against 5-HT. 5-HT antibody binding was mostly in spinal cord tracts rather than DRG neurons somata (enlarged box B-a). Inset cartoons represent orientation of images. D, dorsal; V, ventral; SC, Spinal Cord; NC, Notochord. Scale bars represent 20 μm. |