
|
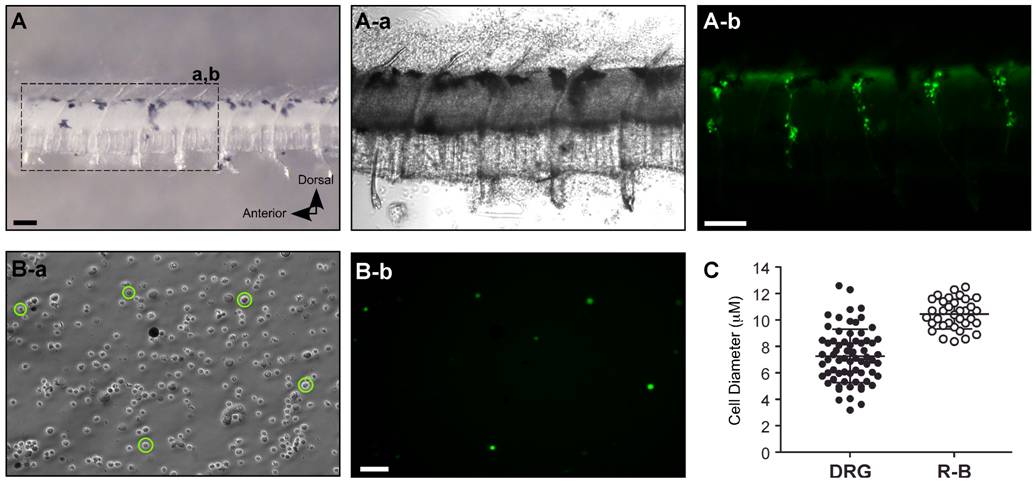
Fig. 2 Isolation of single DRG neurons from isl2b:EGFP transgenic zebrafish.
A, Dissected central trunk region including the spinal cord and notochord from juvenile isl2b:EGFP fish (left panel). Enlarged dashed region shows EGFP-labeled DRG present in every trunk segment from the primary preparation (A-a and b). Note that the trunk segment had been exposed to enzymes at this point. B, Phase-contrast (B-a) and fluorescent (B-b) photomicrographs of acutely dissociated DRG neurons (circled) from the primary preparation. Scale bar in A (top) represent 0.1 mm and scale bar in B (bottom) represent 50 μm. C, Dot plots representing cell diameter of single dissociated DRG (filled circles) and R-B (open circles) neurons. Error bars represent standard deviation and statistical significant was determined using an unpaired t-test with Welch′s correction.