
Fig. 6
- ID
- ZDB-FIG-120824-31
- Publication
- Won et al., 2012 - Characterization of na(+) and ca(2+) channels in zebrafish dorsal root ganglion neurons
- Other Figures
- All Figure Page
- Back to All Figure Page
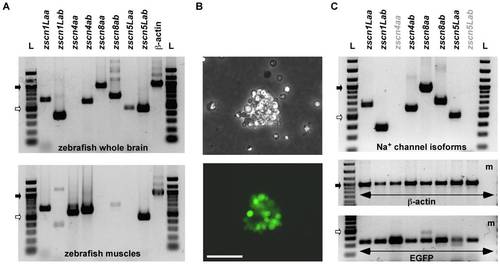
RT-PCR analysis of mRNA encoding Na+ channels from zebrafish DRG. A, Upper and lower electrophoresis images show RT-PCR products generated from specific primer sets coding for Na+ channel isoforms (zscn1Laa/ab, zscn4aa/ab, zscn8aa/ab and zscn5Laa/ab) from zebrafish whole brain and muscles, respectively. B, Phase-contrast (upper) and fluorescent (bottom) images of an example dissociated a DRG cluster as was used for RT-PCR. Scale bar represent 50 &mum. C, RT-PCR products generated from a DRG cluster. PCR products of each lane represent they were generated from same RT reaction tube. Zscn primer sets were used in the same order as arranged in Fig. 6A. PCR was also performed with β-actin as well as EGFP primer sets to establish successful DRG neurons isolation. The resultant PCR products were separated and visualized on 1.5% agarose gel. L: DNA ladder, m: culture media, Filled and opened arrows represent 1 Kbp and 0.5 Kbp size markers, respectively. |