
- Title
-
Differential regulation of p53 function by the N-terminal ?Np53 and ?113p53 isoforms in zebrafish embryos
- Authors
- Davidson, W.R., Kari, C., Ren, Q., Daroczi, B., Dicker, A.P., and Rodeck, U.
- Source
- Full text @ BMC Dev. Biol.

Molecular attributes of zebrafish ?Np53. (A) RT-PCR analysis of zebrafish ?Np53. The zebrafish ?Np53 transcript was detected in cDNA preparations from irradiated embryos using the intron 2 forward primer (I2) and the exon 5 (E5) reverse primer. (B) Comparative view of human and zebrafish ?Np53 sequences. In zebrafish, the alternatively spliced intron 2 (blue highlight) contains an in frame stop codon (T; red) and an alternate start codon (M2; purple) in frame with the p53 ORF of exon 3. (C) Semi-quantitative RT-PCR analysis of p53 isoform expression 6 h post irradiation of 24 hpf embryos. (D) Microinjection of 5′UTR-?Np53 M2-luciferase mRNA into zebrafish embryos. Strong expression of the luciferase reporter gene was achieved using this expression construct, which was abrogated by changing the putative M2 translation initiation site to glycine. |

Effects of ectopic expression of ?Np53 on zebrafish embryos. (A) Steady-state ?Np53 message levels achieved by microinjection as compared to endogenous message levels in irradiated (20 Gy at 24 hpf) embryos; mRNA was isolated from 30 hpf embryos maintained in triplicate dishes of 60 embryos each and injected with 1-2000 pg of mRNA at the 2-4 cell stage. RT-PCR was performed as described in Material and Methods. (B) Embryo survival upon ectopic expression of ?Np53 mRNA. Survival was defined as the presence of a heartbeat. (C) Representative examples of malformations caused by ectopic expression of p53 isoforms as evident at 48 hpf. Embryos were anesthetized with 0.003% tricaine, placed on 3% methylcellulose on a glass depression slide and examined using a fluorescence microscope (Leica MZ16FA) at 10� magnification. (D) Effects on embryo survival of 1 ng of either zebrafish or human ?Np53 message either alone (upper panel) or in combination with zebrafish FLp53 mRNAs (lower panel). For control purposes, mRNAs encoding FLp53(z) and the functionally inactive M214K FLp53(z) mutant were included (upper panel). To ectopically express p53 isoforms, capped mRNAs were generated by cloning zebrafish cDNAs into pCS2+ and synthesized in vitro using the mMessage-mMachine-SP6 kit (Ambion). |

Developmental malformations and hypoplasia caused by ectopic expression of zebrafish ΔNp53 mRNA. (A) Representative images of the head region (upper panel) and quantification (lower panel) of eye size in embryos injected with either zebrafish ?Np53 mRNA or GFP encoding control mRNA (1 ng/embryo). Eye size was determined by outlining the eye using ImageJ software (NIH) and calculating the eye area within the circumference. Results represent the mean � SEM of 5 embryos. The asterisk denotes statistically significant difference (t-test, one tailed; p < 0.01). (B) Representative images of embryos and magnification of somites (upper panel) and quantification (lower panel) of somite size. Somite width was determined using ImageJ software (NIH). Results represent the mean of the width of five somites from three individual fish (mean � SEM; n = 15). Asterices denote statistically significant differences (p < 0.001). The white bar in the GFP mRNA image represents 0.2 mm (10� magnification for all images). In addition to the effects of ?Np53 mRNA the effects of coinjecting a p21-targeted MO are shown. |
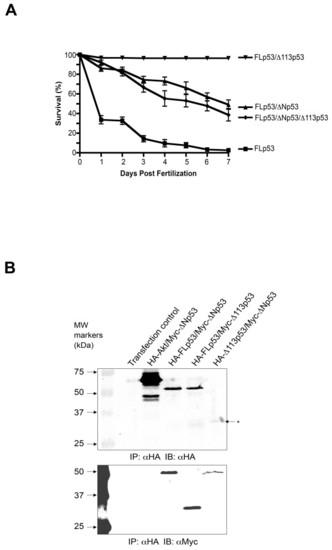
Zebrafish survival in response to simultaneous ectopic expression of all three p53 isoforms in zebrafish embryos. (A) Capped mRNAs encoding FLp53 (0.1 ng mRNA/embryo) alone or in combination with ?Np53 (1 ng mRNA/embryo) or ?113p53 (1 ng mRNA/embryo) or ?Np53 (1 ng mRNA/embryo) together with ?113p53 (1 ng mRNA/embryo) were injected into 1-4 cell embryos and survival was scored over seven days. Standard error was determined using triplicate dishes of 60 embryos each. Capped mRNA of green fluorescent protein (GFP; 2 ng RNA/embryo) was used as a negative control. (B) Molecular interaction of zebrafish p53 isoforms as determined by coimmunoprecipitation experiments using Saos-2 cells. All immunoprecipitations were performed using the HA Tag IP/Co-IP kit (Pierce, Rockford IL). The immunoprecipitates were subjected to SDS-PAGE and immunoblotted using antibodies recognizing the HA- and Myc-tags. The upper panel shows immunoblot detection of the HA-tag whereas the lower panel shows blots probed with antibodies detecting the Myc-tag. Experimental conditions were as follows: (1) Transfection control, (2) HA-Akt and Myc-?Np53 (3) HA-FLp53 and Myc-?Np53, (4) HA-FLp53 and Myc-?113p53, (5) HA-?113p53 and Myc-?Np53. The asterisk denotes the HA-?113p53 band. Expression of transgenes was validated by Western blot analysis of whole cell extracts (see Additional file 2). |

Morphological alterations induced by ectopic ?Np53 expression are partially rescued by knock-down of p21 expression and completely rescued by knock-down of FLp53. (A) Quantitative RT-PCR analysis of steady-state p21 and ?113p53 transcript levels at 30 hpf in unirradiated embryos microinjected with 1 ng/ml of mRNAs as indicated. (B) Quantitative RT-PCR analysis of steady-state p21 and ?113p53 transcript levels in irradiated (20 Gy at 24 hpf) embryos harvested at 30 hpf. (C) Representative images of whole embryos (48 hpf) injected with 1 ng mRNA encoding ?Np53 and MOs targeting either p21 [21] or FLp53 [11] or standard MO control (GeneTools). MO solutions (1 mM) were prepared in sterile water, diluted 3:1 (v:v) with Phenol Red, and 4 nL injected into 1-2 cell embryos. |

Quantification of apoptosis in zebrafish embryo as determined by acridine orange staining. Acridine orange staining was performed on 24 hpf embryos injected with zebrafish (z) or human (h) ?Np53 mRNA (1 ng/embryo) as indicated. Statistically significant differences relative to control embryos injected with mRNA encoding GFP at p < 0.05 (one-tailed t-test) are indicated by an asterisk. A double asterisk indicates a statistically significant difference at p < 0.01. Representative images of 24 hpf embryos are shown in the right panels. |

Immunoblot analysis of protein extracts prior to immunoprecipitation. To control for expression prior to coimmunoprecipitation immunoblot analyses were carried out on protein extracts of transfected Saos2 cells. Results shown are of immunoblot analysis of cell extracts using the HA- and Myc-tag antibodies. The upper panel shows the immunoblot using the anti-HA antibody. The lower panel shows the immunblot using the anti-Myc antibody. All proteins were expressed as expected. Note that the Myc antibody also detects endogenous Myc. |

Quantification of apoptosis associated with ectopic p53 isoform expression in zebrafish embryos. Acridine orange staining was performed on 24 hpf embryos co-injected with zebrafish ?Np53 mRNA and morpholinos (MOs) targeting either p21 (A) or FLp53 (B). Each column represents 5 embryos and images show representative embryos for each treatment group. Statistically significant differences (p < 0.05) relative to negative control (phenol red injected) are indicated by an asterisk. Representative images of 24 hpf embryos injected with mRNA/MO combinations are shown in the panels next to the bar graphs. |
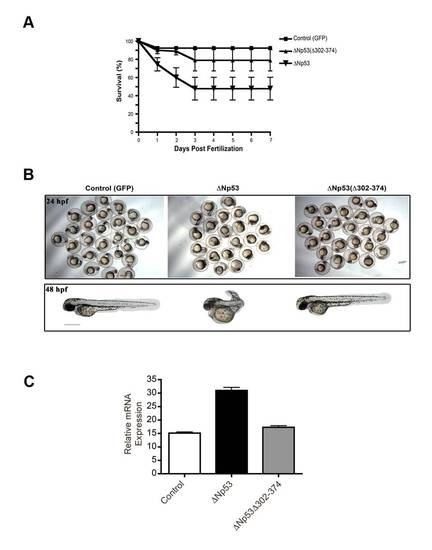
Survival and morphological appearance of zebrafish embryo injected with C-terminally truncated ?Np53(?302-374) mRNA. (A) Triplicate dishes of 30 embryos each were injected with mRNA encoding GFP (control), ?Np53 mRNA or ?Np53(?302-374) mRNA lacking the dimerization domain. Survival was determined by the presence of a heartbeat was assessed over 7 days. (B) Upper panel: representative images of zebrafish embryos at 24 hpf. Lower panel: representative images of single embryos at 48 hpf. Bar (lower panel) = 0.5 mm. (C) Injection of ?Np53(?302-374) mRNA did not affect steady-state p21 message levels (grey bar). This is in contrast to dimerization-competent ?Np53 mRNA containing C-terminal sequences corresponding to the p53 α isoform used as a positive control (black bar). |

Characterization of ?Np53-specific morpholino and effects on target gene expression. (A) Efficacy of ?Np53 knockdown by the morpholino directed against sequences in intron 2 of ?Np53. The effect of ?Np53 MO on a construct containing the 5′ sequences of ?Np53 driving luciferase expression and injected into zebrafish embryos at the 2-4 cell stage was measured and compared to the effects of a mismatch MO control (see Table 1). (B) Effect of ?Np53 MO on p21 and ?113p53 steady-state transcript levels as determined by RT-qPCR in irradiated embryos (IR (20 Gy) at 24 hpf, RNA isolation at 30 hpf). For comparison downregulation of target gene expression by FLp53-directed MO [11] are shown (grey bars). All results are shown were statistically different (p < 0.05; ANOVA-Bonferroni test) relative to mRNA expression levels of unirradiated embryos. Control mock-injected embryos (white bars) received 20 Gy at 24 hpf. |