- Title
-
Growth in the larval zebrafish pectoral fin and trunk musculature
- Authors
- Patterson, S.E., Mook, L.B., and Devoto, S.H
- Source
- Full text @ Dev. Dyn.
|
Hyperplastic growth of trunk muscle in zebrafish larvae. A: Methylene blue-stained section through the trunk of a 4.5 mm larva. Hyperplastic growth at this stage is predominantly by stratified hyperplasia. Note the abundance of small diameter fibers at the lateral surface of the fast muscle, and absence of small diameter fibers within the fast muscle. B: Methylene blue-stained section through the trunk of a 6.0 mm larva. Small fibers are apparent within the fast muscle, indicating mosaic hyperplasia (red arrowheads) C: Myogenin labeling in a 6.0 mm larval trunk. Note the mosaic appearance of myogenin labeling in the trunk, suggesting mosaic differentiation of muscle. Mosaic hyperplasia is also evident by the appearance of small diameter fibers within the fast muscle (red arrowheads). Scale bars = 50 μm in A-C, 25 μm in insets. EXPRESSION / LABELING:
|
|
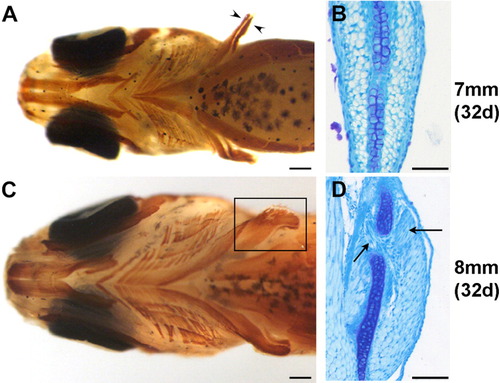
Changes in pectoral fin musculature between 7.0 mm standard length (SL; A,B) and 8.0 mm SL (C,D), A: Ventral view of the musculature of the 7.0 mm larva. Musculature has been labeled in whole-mount with MF20 antibody (brown). The pectoral fin musculature consists of two distinct masses on either side of the endoskeletal disk (arrowheads). B: Transverse section of the pectoral fin of a 7.0 mm larva stained with methylene blue, showing muscle masses on either side of the central endoskeletal disk. C: Ventral view of the musculature of the 8.0 mm larva labeled with MF20 (brown); the fin muscle is boxed. D: Transverse section of a pectoral fin of an 8.0 mm larva demonstrating the beginning of splitting of the muscle masses (arrows). Scale bars 250 μm in A,C, 50 μm in B,D. |
|
The pectoral fin musculature during the late larval period consists of only fast muscle fibers. A: Transverse section of juvenile pectoral fin (15 mm SL). There are small populations of S58-positive slow fibers at the periphery of the individual muscles. B: Lateral view of the pectoral fin of a 6.5 mm larva stained in whole-mount for slow fibers (S58, green) and all fibers (MF20, red). There are no slow fibers stained within the pectoral fin (bracket), but slow fibers are apparent within the trunk (arrows). C: Transverse section of a 6.5 mm larva demonstrating that the pectoral fin musculature consists of only fast fibers. Slow fibers within the trunk are labeled by S58 at this stage (arrows). Scale bars = 100 μm in A,B, 25 μm in C. |
|
Growth of muscle in the late larval pectoral fin occurs by hyperplasia and hypertrophy. A-C: Transverse sections of methylene blue-stained pectoral fins during the late larval period. There is a large increase in overall size of the pectoral fin musculature from 4.5 mm (A) to 6.5 mm (C). D: Quantification of total muscle fibers/section shows an increase in the number of muscle fibers during the late larval period. Between 4.5 and 6.5 mm, the number of fibers almost doubles, increasing from a mean of 148 fibers to a mean of 279 fibers (4.5 mm, n = 3; 5.5 mm, n = 4; 6.5 mm, n = 4). D: Increase in the mean cross-sectional area of the 20 largest fibers suggests that hypertrophy is contributing to muscle growth during this period (all sizes, n = 3). Scale bar = 25 μm in A-C. |
|
Addition of new muscle fibers occurs at the periphery of the existing muscle masses. A: Transverse section of the pectoral fin of a 6.5 mm larva stained with methylene blue and basic fuchsin. Fibers with a small cross-sectional area (CSA) are closest to the skin. Inset shows small fibers near the skin. B: Methylene blue-stained transverse section through an adductor muscle in the pectoral fin of an adult (32 mm). No small, new fibers are within the mass of the muscle. Ventral is to the bottom. C: Scatter plot showing the relationship between the CSA of a muscle fiber and its position relative to the skin and endoskeletal disk. Each point represents one muscle fiber. Distances were determined using the GIS program ArcGIS by mapping the relationship between the center of each fiber and the closest point on the skin or endoskeletal disk. D: Chart showing the relationship between bins of fiber size (CSA) and the median distance from the skin. Muscle fibers that are less than 10 μm2 in CSA have a smaller median distance from the skin in all larval specimen sizes (4.5 mm, n = 3; 5.5 mm, n = 3; 6.5 mm, n = 4). Scale bar = 25 μm in A, 100μm in B. |
|
Molecular characterization of myogenesis corresponds with the location of new, small diameter fibers. A-C: Expression of molecular markers of myogenesis in 6.0 mm larval pectoral fins. A: Pax7 (Green) is expressed in cells superficial to the existing muscle masses (MF20, Cyan). A subset of Pax7 expressing cells coexpress Myogenin (Red), signifying myogenic differentiation. Insets signify boxed region and show a nucleus that expresses both Pax7 and Myogenin (arrowheads). B: The muscle regulatory factor myod is expressed by cells at the periphery of the muscle masses. C: Myogenin is expressed by cells at the periphery of the muscle masses. Scale bar = 25 μm. EXPRESSION / LABELING:
|

Unillustrated author statements EXPRESSION / LABELING:
|


