
- Title
-
Glycine receptors regulate interneuron differentiation during spinal network development
- Authors
- McDearmid, J.R., Liao, M., and Drapeau, P.
- Source
- Full text @ Proc. Natl. Acad. Sci. USA

GlyR perturbations during development impair motor network function. (A) In situ hybridization of GlyR mRNA transcripts in longitudinal optical sections of the spinal cord. GlyR α2 mRNA transcripts are detected at 1 day (1d α2) in development (arrowheads in i) but not at 2 days (2d α2; ii). GlyR α1 mRNA expression is absent at 1 day in development (1d α1; iii) and is widely expressed by 2 days (2d α1; iv). Broken lines demarcate dorsal and ventral limits of the spinal cord. (B) mAb4a-stained cryosections of embryos 24 h after fertilization reveal GlyR expression on cells of wild-type fish (WT 1d; i) and α1 AMO-injected fish (α1 k/d 1d; iii) but not α2 AMO-injected fish (α2 k/d 1d; ii). At 2 days mAb4a staining is increased in wild-type larvae (WT 2d; iv) and α2 knockdown larvae (v) but not α1 knockdown larvae (vi). mAb4a staining is observed in mismatch α2 and mismatch α1 AMO-injected embryos (vii and viii) and larvae (ix and x). Larvae coinjected with α1 and α2 AMOs have no detectable mAb4a staining (xi). (Scale bar: 20 μm.) (xii) Western blots showing mAb4a labeling in wild-type and GlyR α2 mismatch (MM) embryos (1d) and larvae (2d) and α2 knockdown (α2 k/d) larvae but not α2 knockdown embryos. (C) Twenty-four-hour embryo motoneuron receives glycinergic synaptic bursts (GB) and electrically mediated periodic discharges (PD; n = 9). (D) Twenty-five-hour GlyR α2 knockdown embryo reveals loss of glycinergic bursts (n = 5/5). (E) Motoneuron of a 27-h embryo injected with α1 AMO receives glycinergic synaptic bursts (GB) and electrically mediated periodic discharges (PD). (F) Motoneuron of a 25-h embryo injected with the GlyR α2 mismatch AMO receives glycinergic synaptic bursts (GB) and electrically mediated periodic discharges (PD). (G) Three-day motoneurons are rhythmically active. (H) Arrhythmic motoneuron activity elicited by touching in a 3-day GlyR α2 knockdown zebrafish (n = 18/29). (I) Motoneurons of 3-day fish injected with GlyR α2 mismatch AMO are rhythmically active (n = 6/6). (J) Motoneurons of 3-day fish injected with the GlyR α1 AMO are rhythmically active (n = 51/51). Voltage clamp holding potential in C–F was -60 mV. Insets in G–J depict enlarged portions of traces underlined with bars. PHENOTYPE:
|
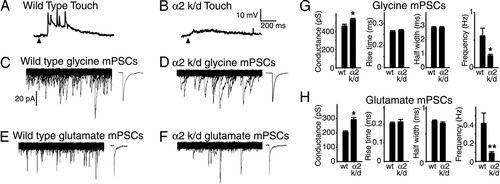
Synaptic activity is reduced in α2 GlyR knockdown fish. Spinal motoneuron responses evoked by brief touches in wild-type zebrafish (A; n = 5/5) and GlyR α2 knockdown zebrafish (B; α2 k/d; n = 9/9) at 3 days in development. Arrowheads indicate onset of touch. (C and D) Glycinergic mPSCs (isolated with 1 μM TTX, 10 μM bicuculline, and 1 mM kynurenic acid) in spinal motoneurons voltage-clamped at -60 mV in wild-type zebrafish (C; n = 11) and GlyR α2 knockdown zebrafish (D; α2 k/d; n = 10). Glutamatergic mPSCs (isolated with 1 μM TTX, 10 μM bicuculline, and 1 μM strychnine) in spinal motoneurons voltage-clamped at -65 mV in wild-type zebrafish (E; n = 12) and 3-day GlyR α2 knockdown zebrafish (F; n = 10). C–F Left display 500 overlaps of consecutive 200-ms traces of activity. C–F Right display 25 averaged mPSCs for each condition. (G and H) Peak conductance, rise time, half-width, and frequency of GlyR mPSCs (G) and glutamatergic mPSCs (H) in wild-type zebrafish and α2 knockdown zebrafish (α2 k/d). -, P < 0.01. PHENOTYPE:
|

Antibody staining reveals a decrease in spinal interneurons. (A–H) Lateral views of whole-mount zebrafish spinal cord stained with anti-Hu antibody in wild-type fish at 1, 2, and 3 days in development (A–C), α2 mismatch AMO-injected (α2 MM) fish at 2 days in development (D), GlyR α2 knockdown (α2 k/d) fish at 1, 2, and 3 days in development (E–G), and α1 knockdown fish (α1 k/d) at 2 days in development (H). (I–K) Anti-GFP antibody labeling of neurog1-positive Rohon–Beard sensory neurons (labeled with arrowheads) of wild-type (I), GlyR α2 knockdown (J; α2 k/d), GlyR α2 mismatch AMO-injected (K; MM), and α1 knockdown (L; α1 k/d) zebrafish spinal cords. (M–P) Lateral view of Pax 2 (green) labeling of interneurons and HB9 (red) labeling of secondary motoneurons in 2-day zebrafish spinal cord of wild-type (M), GlyR α2 knockdown (N; α2 k/d); GlyR α2 mismatch AMO-injected (O; α2 MM), and α1 knockdown (P; α1 k/d) zebrafish spinal cords. Dotted lines demarcate dorsal (D) and ventral (V) limits of the spinal cord. (Scale bar: 30 μm.) (Q) Graph of average number of Hu-labeled cells in 100-μm segments of spinal cord between days 1 and 3 in development for wild-type (open circles, broken line) and GlyR α2 knockdown (α2 k/d; solid circles, solid line) fish. The number of Hu-labeled neurons in wild-type fish was significantly different from GlyR α2 knockdown fish at each developmental stage (P = 2 × 10⁻³ at day 1; P = 4 × 10⁻⁵ at day 2; P = 3 × 10⁻⁵ at day 3). (R) Mean number of neurog1-labeled (gray bars), HB9-labeled (white bars), and Pax 2-labeled (black bars) cells in a 100-μm section of spinal cord for each experimental condition. n values from which means were taken are illustrated below (for wild type) and above (for GlyR α2 k/d) each circle in M and above each bar in N. **, P = 10-7. PHENOTYPE:
|

Antibody staining reveals an increase in BrdU-incorporated cells in α2 knockdown fish. Shown are lateral views of BrdU-incorporated cells in whole-mount spinal cord sections of wild-type fish at 1, 2, and 3 days in development (A–C), GlyR α2 mismatch (α2 MM) at 2 days in development (D), GlyR α2 knockdown (α2 k/d) fish at 1, 2, and 3 days in development (E–G), and GlyR α1 knockdown (α1 k/d) fish at 2 days in development (H). Dotted lines demarcate dorsal (D) and ventral (V) limits of the spinal cord. (Scale bar: 25 μm.) (I) Graph of average number of BrdU-labeled cells in a 100-μm segment of spinal cord between days 1 and 3 in development for wild-type (open circles, broken line) and GlyR α2 knockdown (α2 k/d; solid circles, solid line) fish. The number of BrdU-labeled neurons in wild-type fish was significantly different from GlyR α2 knockdown fish at day 2 (P = 10-7) and day 3 (P = 10-7) but not day 1 (P = 0.9). The n values from which means were taken are illustrated below (for wild type) and above (for GlyR α2 k/d) each circle in G. (J and K) zrf-1 antibody labeling of radial glia in sections of 2-day wild-type (J) and α2 knockdown (K; α2 k/d) larvae. (L and M) Lateral view of acridine orange-labeled apoptotic cells (arrowheads) in wild-type (L) and GlyR α2 knockdown (M; α2 k/d) fish. (N Left) mAb4a (green) and PAX6 (red) costaining in a hemisomite cross section of the embryo spinal cord. (N Right) Diagram depicts spinal region imaged. PHENOTYPE:
|