FIGURE SUMMARY
Title

Mimicry Embedding Facilitates Advanced Neural Network Training for Image-Based Pathogen Detection

Authors
Yakimovich, A., Huttunen, M., Samolej, J., Clough, B., Yoshida, N., Mostowy, S., Frickel, E.M., Mercer, J.
Source
Full text @ mSphere

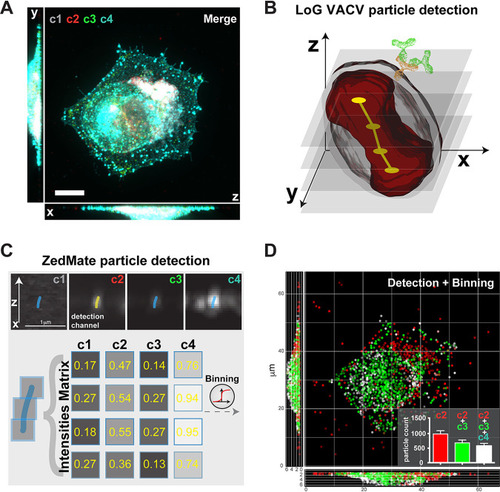
ZedMate facilitates detection and classification of VACV particles in infected cells. (A) Merged four-channel fluorescent image of a HeLa cell infected with VACV (see Fig. S1A for channel details). Bar, 10 μm. (B) Illustration of Laplacian of Gaussian (LoG)-based VACV particle detection in 3D. The dumbbell shape (red) represents a particle sliced in optical Z-sections (semitransparent gray), providing a point signal for LoG detection (yellow) and connected in Z (not to scale). (C) Intensity measurement from detected particles presented as a Z-profile intensity matrix. (D) 3D plot of detected particles color coded according to detected channels and virion category (see Fig. S1B for details). (Inset) Quantification of different particle types. n = 30 cells (3 biological replicates). Values are means and standard errors of the means (SEM).

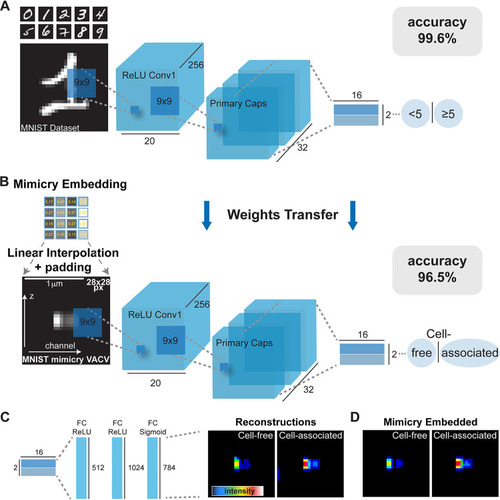
Mimicry embedding allows separation of cell-free and cell-associated VACV particles through weights transfer from a CapsNet trained on the binary MNIST data set. (A) CapsNet architecture for training on the MNIST handwritten digits data set repurposed into a binary classification problem (<5 or ≥5) prior to CapsNet weights transfer. Black numbers represent dimensions of tensors. ReLU, rectified linear unit. (B) Mimicry embedding of VACV Z-profiles detected by ZedMate. The intensity matrix of fluorescence signal (Fig. 1) was embedded to mimic MNIST data using linear interpolation and padding. Bar, 1 μm. CapsNet architecture with pretrained weights from A was used for training on mimicry-embedded VACV particles. (C) Reconstructed particle profiles of the virions separated into cell-free and cell-associated subsets by CapsNet. (D) Representative mimicry-embedded VACV particles for comparison to images in panel C. Statistical validation of machine learning models is provided in Fig. S3.

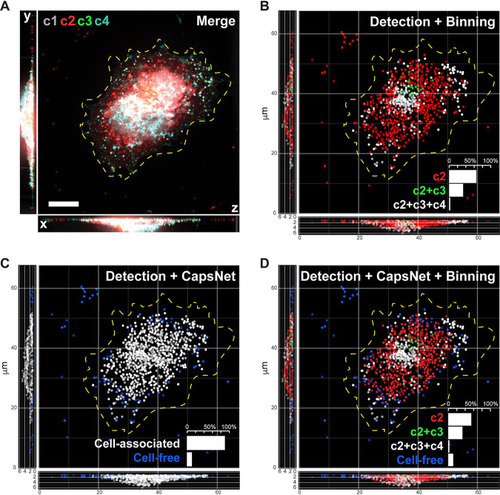
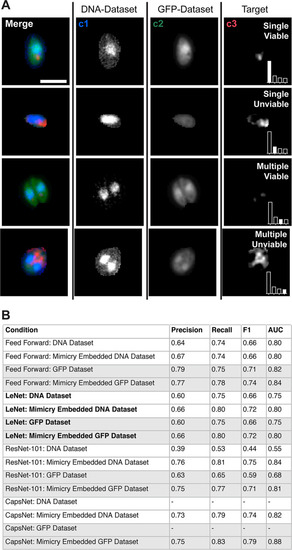
Inference demonstrates that mimicry embedding and trained CapsNet allow efficient classification of VACV particles into four biological classes. (A) Merged four-channel fluorescent image of a HeLa cell infected with VACV previously unseen by CapsNet (see Fig. S1A for channel details). Bar, 10 μm. (B) Respective ZedMate particle detection and classification by conventional binning of fluorescence intensities. (C) Respective inference of cell-free and cell-associated particles detected by ZedMate, mimicry embedded and predicted by a trained CapsNet (Fig. 2B and C). (D) Combined ZedMate particle detection with mimicry-embedded and trained CapsNet results in classification of four types of biologically relevant VACV particles. (Insets) Quantification of the particle types in the respective image. Statistical validation of machine learning models is provided in Fig. S3.

Mimicry embedding can be used for weak-labeling particle classification. (A) Merged four channel fluorescent image of a HeLa cell infected with VACV previously unseen by CapsNet (see Fig. S4A for channel details). (B) ZedMate detection and trained-CapsNet-predicted extracellular and intracellular particles. (Inset) Quantification of intracellular particles. (C) Merged four-channel image of HeLa cell infected with VACV and treated with the entry inhibitor IPA-3, previously unseen by CapsNet. (D) ZedMate detection and trained CapsNet inference of intracellular and extracellular particles. (Inset) Quantification of intracellular particles. (E) Representative reconstruction profiles of extra- and intracellular virions. (F) Representative mimicry-embedded extra- and intracellular VACV particles for comparison to the images in panel E. n = 40 (3 biological replicates) untreated and treated cells each. Detailed model performance (statistical validation) metrics are provided in Fig. S4. Bars, 10 μm.

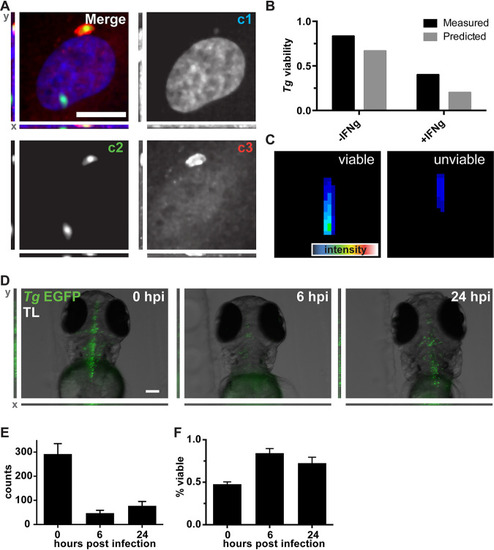
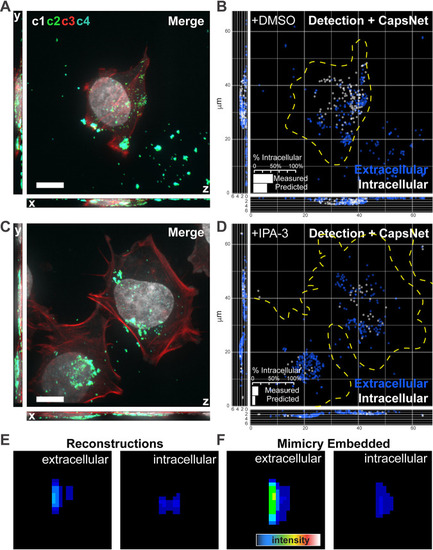
Mimicry embedding and weight transfer employed for Toxoplasma gondii (Tg) viability detection in cell culture and in vivo. (A) Merged three-channel fluorescent image of a HUVEC infected with T. gondii-EGFP. Individual channels represent DNA stain (c1), T. gondii-EGFP (c2), and ubiquitin (c3). A total of 2,694 images were obtained from 3 biological replicates. Bar, 25 μm. (B) Quantification of weakly labeled (measured) and CapsNet-inferred (predicted) viable and unviable parasites. (C) Representative reconstructions of the trained CapsNet network for viable and unviable classes of T. gondii-EGFP Z-profiles. (D) Representative images (maximum-intensity projections) of zebrafish (D. rerio) larvae infected with T. gondii-EGFP at 0, 6, and 24 hpi. The same 10 larvae were followed over time. Bar, 100 μm. (E) ZedMate-detected T. gondii counts at 0, 6, and 24 h postinfection. (F) In vivo inference of T. gondii-EGFP viability over time using the DropConnect viability model trained on in vitroT. gondii data. n = 10 Z-stack images per time point (3 biological replicates). Values are means and SEM. Statistical validation of machine learning models is provided in Fig. S5.

2D Toxoplasma gondii vacuole data set formulated as a multiclass classification problem. Maximum-intensity projections of merged and individual fluorescence channels of T. gondii EGFP vacuoles. Individual channels represent DNA stain (c1; DNA-Dataset), T. gondii EGFP (c2; GFP-Dataset), and ubiquitin (c3), which was used to obtain target information on viability. Bar, 5 μm. (Insets) Bar plots demonstrate proportions of number of examples in classes; filled bars represent the current class. (B) Impact of mimicry embedding on 2D data sets across various neural network architectures. AUC, area under the receiver operating characteristics curve. All metrics are averaged as one-versus-rest across classes.

Acknowledgments
This image is the copyrighted work of the attributed author or publisher, and ZFIN has permission only to display this image to its users. Additional permissions should be obtained from the applicable author or publisher of the image. Full text @ mSphere