IMAGE

FIG 1

ID
ZDB-IMAGE-201003-224
Source
Figures for Yakimovich et al., 2020
Image
Figure Caption

FIG 1

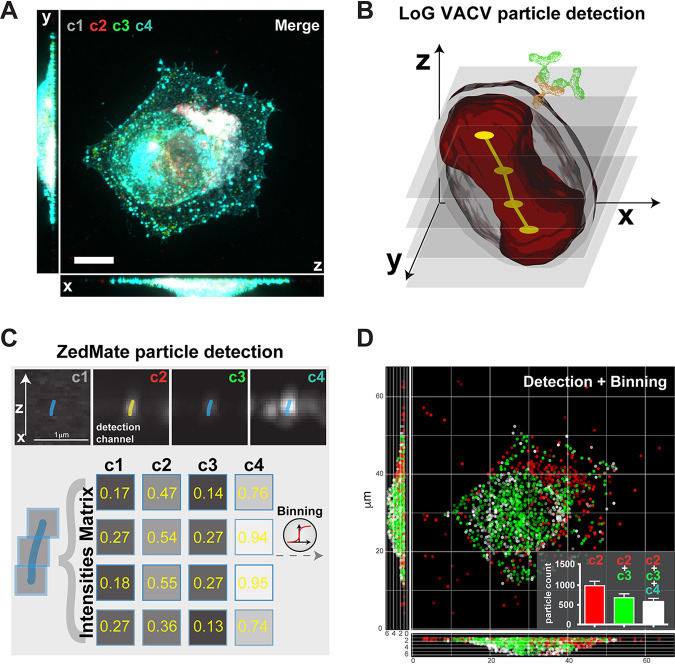
ZedMate facilitates detection and classification of VACV particles in infected cells. (A) Merged four-channel fluorescent image of a HeLa cell infected with VACV (see Fig. S1A for channel details). Bar, 10 μm. (B) Illustration of Laplacian of Gaussian (LoG)-based VACV particle detection in 3D. The dumbbell shape (red) represents a particle sliced in optical Z-sections (semitransparent gray), providing a point signal for LoG detection (yellow) and connected in Z (not to scale). (C) Intensity measurement from detected particles presented as a Z-profile intensity matrix. (D) 3D plot of detected particles color coded according to detected channels and virion category (see Fig. S1B for details). (Inset) Quantification of different particle types. n = 30 cells (3 biological replicates). Values are means and standard errors of the means (SEM).

Acknowledgments
This image is the copyrighted work of the attributed author or publisher, and ZFIN has permission only to display this image to its users. Additional permissions should be obtained from the applicable author or publisher of the image. Full text @ mSphere