FIGURE SUMMARY
Title

The maternal to zygotic transition regulates genome-wide heterochromatin establishment in the zebrafish embryo

Authors
Laue, K., Rajshekar, S., Courtney, A.J., Lewis, Z.A., Goll, M.G.
Source
Full text @ Nat. Commun.

Chromatin of the early zebrafish embryo lacks H3K9me3. a Developmental stages used for heterochromatin analysis. Zebrafish embryonic stage schematics are reproduced from Kimmel et al.22 with permission from John Wiley & Sons Inc. b Representative images showing H3K9me3 immunofluorescent antibody labeling of nuclei from fixed embryos at 2.7, 3.7, 4.5, and 6 h post fertilization (hpf). Images are representative of three independent experiments with at lease 15 embryos observed at each time point in each experiment. Top panels show H3K9me3 labeling (red). Bottom panels show H3K9me3 (red) overlaid with 4′,6-diamidino-2-phenylindole (DAPI) (blue). All images were taken under identical conditions, the scale bar represents 1 μm. c Western blots for H3K9me3, histone H3, and α-tubulin. For each time point, total protein extracts were isolated from 20 embryos, and one-third of the protein extract for each sample was loaded for western blot. d, e H3K9me3 enrichment measured by chromatin immunoprecipitation with sequencing (ChIP-seq) at 2.5, 4.5, and 6 hpf. d Screen shot of H3K9me3 enrichment at an LTR transposon in a representative genomic region. e Heatmap depicting H3K9me3 enrichment across all 17,621 H3K9me3 peaks identified in 6 hpf embryos. Signals are centered on peak centers and include ±5000 bp. f H3K9me3 enrichment at Satellite-1 (Sat1) pericentromeric repeats at 2.7, 3.7, 4.5, and 6 hpf, measured by ChIP and presented as fold enrichment over an immunoglobulin G (IgG)-only control. P values were calculated by ordinary one-way analysis of variance (ANOVA), with corrections for multiple testing. Error bars indicate the standard error of the mean (SEM). Source data for panel c are provided as a source data file

EXPRESSION / LABELING:
Antibody:
Fish:
Anatomical Terms:
Stage Range: 16-cell to Shield

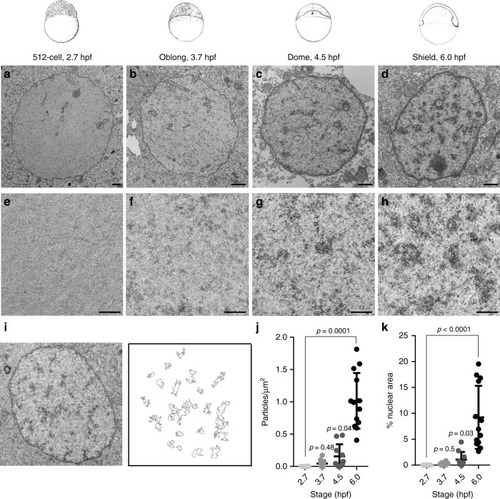
The early zebrafish embryo lacks condensed chromatin ultrastructure. Zebrafish embryonic stage schematics are reproduced from Kimmel et al.22 with permission from John Wiley & Sons Inc. ah Transmission electron micrographs (TEMs) of representative nuclei from embryos at 2.7, 3.7, 4.5, and 6 h post fertilization (hpf). Images of representative nuclei at specified time points. eh Higher magnification images (×20,000) of nuclear interior at specified time points. All scale bars (ah) indicate 1 μm. i Representative image illustrating particle selection. j Quantification of the number of particles per nuclear μm2 in TEM images at 2.7, 3.7, 4.5, and 6 hpf. k Quantification of the percent nuclear area covered by particles in TEM images at 2.7, 3.7, 4.5, and 6 hpf. Nuclei from three embryos were assessed per time point, and electron-dense aggregates were quantified in four to six representative nuclei from each embryo. Each point represents data from one nucleus. P values were calculated using the Kruskal–Wallis test and corrected for multiple comparisons, error bars indicate standard deviation (SD)

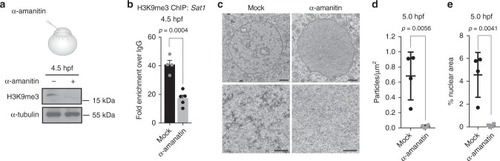
Blocking zygotic transcription impairs heterochromatin. a Western blot for H3K9me3 (top) and α-tubulin (bottom) using protein extracted from embryos that were either mock injected (−) or injected with 0.2 ng of α-amanitin (+) at the one-cell stage. Protein was collected for analysis at 4.5 h post fertilization (hpf). b Chromatin immunoprecipitation with sequencing (ChIP) for H3K9me3 enrichment at pericentromeric Satellite-1 (Sat1) repeats in wild-type and α-amanatin-injected embryos. Embryos were collected for analysis at 4.5 hpf. P values were calculated using the Student’s t test; error bars indicate SEM. c Transmission electron microscopy (TEM) images demonstrating a lack of condensed chromatin ultrastructure in 5.0 hpf embryos that were injected with α-amanatin at the one-cell stage. Bottom panels represent higher magnification images (×20,000) of nuclear interior in mock- and α-amanatin-injected embryos at specified time points. Scale bars indicate 1 μm. d, e Quantification of the number of electron-dense aggregates per nuclear μm2 (d) and percent nuclear area covered by aggregates (e) in mock- and α-amanitin-injected embryos at 5.0 hpf. Particles/μm2 and percent nuclear area were measured in nuclei from each of four α-amanitin- and four mock-injected embryos. Each graphed data point represents data from one embryo; values for each embryo are the average of six to ten representative nuclei. Error bars indicate SD. Source data for panel a is provided as a source data file

ZFIN is incorporating published figure images and captions as part of an ongoing project. Figures from some publications have not yet been curated, or are not available for display because of copyright restrictions.

EXPRESSION / LABELING:
Antibody:
Fish:
Knockdown Reagents:
Anatomical Term:
Stage: Dome
PHENOTYPE:
Fish:
Knockdown Reagents:
Observed In:
Stage: Dome

ZFIN is incorporating published figure images and captions as part of an ongoing project. Figures from some publications have not yet been curated, or are not available for display because of copyright restrictions.

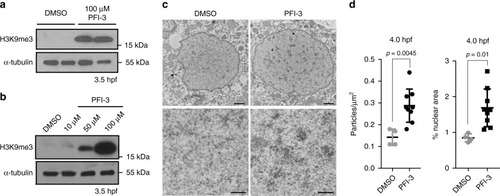
Smarca2 inhibition accelerates the timeline of chromatin compaction. a Western blot for H3K9me3 (top), and α-tubulin (bottom) in embryos that were either mock injected or injected with 100 μM of the Smarca2 inhibitor PFI-3 at the one-cell stage. Protein was collected for analysis at 3.5 h post fertilization (hpf). b Western blot using embryos injected with increasing concentrations of PFI-3. Protein was collected for analysis at 3.5 hpf. c Electron micrographs demonstrating increased levels of chromatin compaction in 4.5 hpf embryos that were injected with dimethyl sulfoxide (DMSO) or 100 μM PFI-3 at the one-cell stage. Bottom panels represent higher magnification images (×20,000) of nuclear interior in mock- and PFI-3-injected embryos at specified time points. All scale bars indicate 1 μm. d Quantification of the number of particles per nuclear μm2 and percent nuclear area. Each data point indicates an individual embryo, for each embryo (four DMSO and nine PFI-3-injected embryos) values for particles per um2 and percent nuclear area were averaged from five to ten representitive nuclei. P values were calculated using the Student’s t test; error bars indicate SD. Source data for panels a and b is provided as a source data files

EXPRESSION / LABELING:
Antibody:
Fish:
Condition:
Anatomical Term:
Stage: High
PHENOTYPE:
Fish:
Condition:
Observed In:
Stage Range: High to Dome

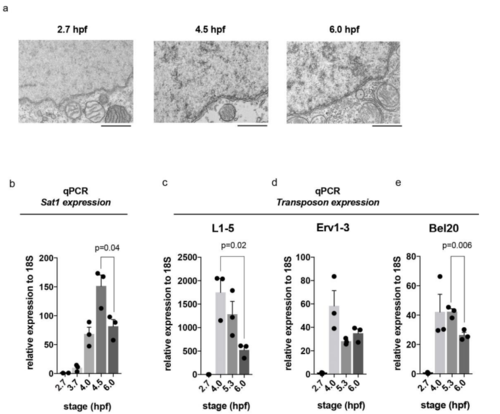
Elevated repetitive transcripts at stages with less condensed chromatin ultrastructure (a) TEM images showing nuclear periphery and cytoplasmic organelles at 2.7, 4.5 and 6.0 hpf. Scale bar equals 1 m. (b-e) Quantitative RT-PCR showing increasing levels of transcripts derived from repetitive elements following the onset of zygotic transcription. A decline in transcript levels at 6.0 hpf correlates with the onset of heterochromatin formation. All p-values were calculated using the students t-test, error bars indicate SEM.

Abnormal development following Smarca2 depletion or inhibition (a) Bright field images of 24 hpf zebrafish larvae following injection with 2 ng of morpholinos targeting Smarca2 (MO1 or MO2) or 100 M PFI-3 at the 1 cell stage. Scale bars represent 1 mm. (b) Bright field images of 48 hpf zebrafish larvae following injection with 2 ng of morpholinos targeting Smarca2 (MO1 or MO2) or 100 M PFI-3 at the 1 cell stage. Scale bars represent 1 mm. (c) Quantification of embryos that were normal, dead or showed anomalies consistent with panel a, at 24 hpf. A minimum of 70 embryos were scored per condition. Numbers are representative of three independent experiments.

Acknowledgments
This image is the copyrighted work of the attributed author or publisher, and ZFIN has permission only to display this image to its users. Additional permissions should be obtained from the applicable author or publisher of the image. Full text @ Nat. Commun.