
IMAGE
Fig. S2
- ID
- ZDB-IMAGE-190816-1
- Publication
- Laue et al., 2019 - The maternal to zygotic transition regulates genome-wide heterochromatin establishment in the zebrafish embryo
- All Figures
- Figures for Laue et al., 2019
Image
|
Figure Caption
Fig. S2
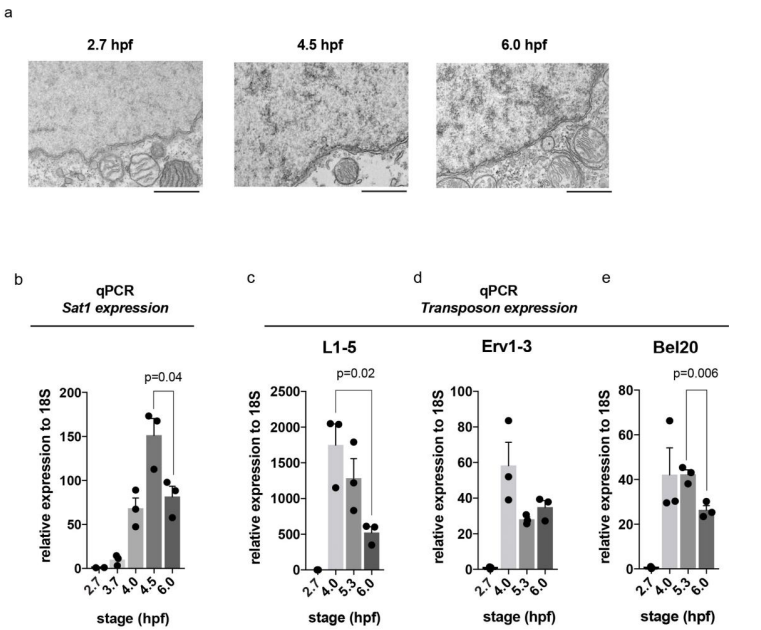
Elevated repetitive transcripts at stages with less condensed chromatin ultrastructure (a) TEM images showing nuclear periphery and cytoplasmic organelles at 2.7, 4.5 and 6.0 hpf. Scale bar equals 1 m. (b-e) Quantitative RT-PCR showing increasing levels of transcripts derived from repetitive elements following the onset of zygotic transcription. A decline in transcript levels at 6.0 hpf correlates with the onset of heterochromatin formation. All p-values were calculated using the students t-test, error bars indicate SEM.
Acknowledgments
This image is the copyrighted work of the attributed author or publisher, and
ZFIN has permission only to display this image to its users.
Additional permissions should be obtained from the applicable author or publisher of the image.
Full text @ Nat. Commun.