
Fig. 6
- ID
- ZDB-IMAGE-190723-1156
- Antibodies
- Publication
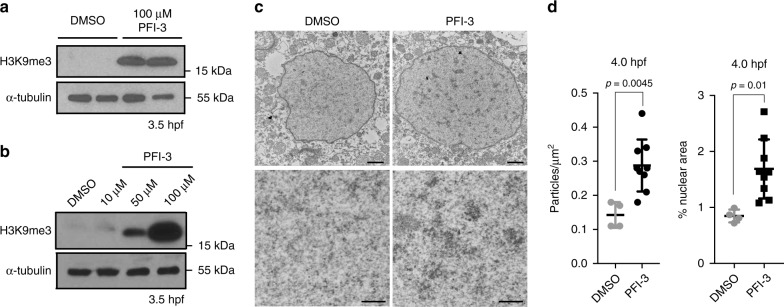
- Laue et al., 2019 - The maternal to zygotic transition regulates genome-wide heterochromatin establishment in the zebrafish embryo
- All Figures
- Figures for Laue et al., 2019
|
Fig. 6
Smarca2 inhibition accelerates the timeline of chromatin compaction.