
- Title
-
Characterization of Proliferating Neural Progenitors after Spinal Cord Injury in Adult Zebrafish
- Authors
- Hui, S.P., Nag, T.C., Ghosh, S.
- Source
- Full text @ PLoS One
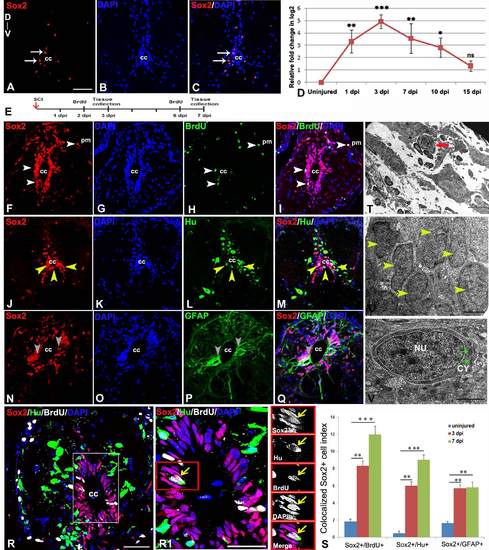
Immunohistochemical, ultrastructural and quantitative analysis of proliferating neural progenitors in injured zebrafish spinal cord: A-C) An uninjured cord section showing a few SOX2+ (A, arrow) cells in the grey matter around central canal (cc). D) Quantitative RT-PCR of sox2 expression showing fold change (red graph) and pattern of expression at different time points after injury. Error bar indicates the value of s.e.m. (n = 3) and statistical significance represented as p value (ANOVA; ***P≤0.001, **P≤ 0.01, *P≤0.05, ns = not significant). E) Drawing represents the time frame of SCI, BrdU treatment and tissue collection for cell proliferation experiments. F-I) A 3 dpi cord section shows many SOX2+positive cells in ependyma around the central canal (cc) and also near pial membrane (pm), counter stained with DAPI (G) In the same section some of the SOX2+ cells are also proliferating (H) and are SOX2+/BrdU+ (I, white arrowheads). Note that some SOX2+/BrdU+ colocalized cells are also present near pial membrane (white arrows). J-M) A 3 dpi cord section shows many SOX2+ positive cells (J, yellow arrowheads) in ependyma around the central canal (cc), counter stained with DAPI. (K) In same section some of the SOX2+ cells are colocalized with HuC/D+ cells (M, yellow arrowheads). N-Q) A 3 dpi cord section showing many SOX2+ cells (N, grey arrowheads) in the grey matter, counter stained with DAPI (O) and GFAP+ cells (P) around ependyma. Same section showing few SOX2+/GFAP+ colocalized cells (grey arrowheads) around the central canal (cc). R) A 3 dpi cord section stained with SOX2, HuC/D, BrdU and DAPI. R1) Higher magnification of boxed area in R showing a colocalized SOX2+/HuC/D+/BrdU+ cell around central canal (yellow arrow; cc). S) Bar graph indicates quantification of proliferating SOX2+ cells, SOX2+/HuC/D+ colocalized cells and SOX2+/GFAP+ colocalized cells in uninjured, 3 dpi and 7 dpi cord after crush injury. Values represent as mean ± s.e.m. (n = 5). Statistical significance represented as p value (Student’s t-test; *p<0.01, **p<0.001). T) A small sized progenitor (red arrow) with compact nucleus in the injury epicenter of a 3 dpi cord section. U) Several newly formed cells (yellow arrowheads) in the injury site of a 7 dpi cord with progenitor phenotype. V) A newly formed progenitor cell with few cytoplasmic organelles (green arrows) in the injury site of a 10 dpi cord. ‘NU’ and ‘CY’ denote nucleus and cytoplasm respectively, white dotted line demarcate the boundaries of the nucleus and the cell. The values in bar represents Mean ± s.e.m. (n = 5), statistical significance represented as p value (Student’s t-test; **p<0.01, ***p<0.001). ‘cc’ denotes central canal of the cord. Scale bar = 50 µm (A-C, F-Q), 20 µm (R), 10 µm (R1), 2 µm (T), 1 µm (U), 500 nm (V). |

Immunohistochemical and ultrastructural analysis of glial progenitors in uninjured and injured zebrafish spinal cord: A-D) A cross section of uninjured cord showing A2B5+ cells (white arrows) in white matter and pial membrane (pm, A and D); BrdU+ cells (red arrow, B); A2B5+/BrdU+ colocalized cells (yellow arrows, C) and DIC image of section C (D). E-H) A 7 dpi cord section showing many A2B5 positive cells (white arrow) in white matter and very few in grey matter (white arrow, E); BrdU+ cells (red arrow, F); A2B5+/BrdU+ colocalized cells (yellow arrow, G) and DIC of section G (H). I-L) Higher magnification of boxed area in G showing A2B5+ cells (white arrows, I); BrdU+ cells (red arrows, J); A2B5+/BrdU+ colocalized cells (yellow arrows, K) and DIC image of section K (L). M-P) An uninjured cord section showing NG2+ bipolar cells (white arrowhead) in the white matter of the cord (M); BrdU+ positive cells (N); NG2+/BrdU+ colocalized cells (yellow arrowhead, O) and DIC image of section O (P). Q-T) A 7 dpi cord section showing many NG2+ cells (white arrowheads) in white matter (Q); BrdU+ cells (green arrowhead, R); NG2+/BrdU+ colocalized cells (yellow arrowhead, S) and DIC image of section R (T). U-X) Higher magnification of boxed area in S showing NG2+ cells (white arrowheads, U); BrdU+ cells (green arrowheads, V); NG2+/BrdU+ colocalized cells (yellow arrowheads, W) and DIC image of section W (X). Y) Ultrastructure of an uninjured cord section showing an oligodendrocyte with many cisternae (black arrowheads) of smooth endoplasmic reticulum (SER), microtubules (MT, red arrows) in the cytoplasm but no intermediate filaments. Z) A 7 dpi cord section showing a proliferating astrocyte progenitor with a prominent dumb-bell shaped compact dividing nucleus (blue arrows) with characteristic heterochromatin body (HC) in the injury site. Z1) A newly formed oligodendrocyte with small cytoplasmic area where microtubules (MT, red arrows) are obvious and a few cytoplasmic organelles (green arrows) like primary lysosome (pLY) is present at the injury site of 10 dpi cord section. Note that axolemma (AXL) is in close vicinity of the cytoplasm. ‘NU’ indicates nucleus of the cell. a) Drawing represents the time frame of SCI, BrdU treatment and tissue collection for cell proliferation experiments. b-e) Quantification of A2B5+ cells (b), A2B5+/BrdU+ cells (c), NG2+ cells (d), NG2+/BrdU+ cells (e) in uninjured, 3 dpi, 7 dpi and 15 dpi cord. The values in bar represents Mean ± s.e.m. (n = 5), statistical significance represented as p value (Student’s t-test; **p<0.01, ***p<0.001). ‘cc’ denotes central canal of the cord. Scale bar = 50 µm (A-H, M-T); 20 µm (I-L, U-X); 1 µm (Y, Z, Z1). |
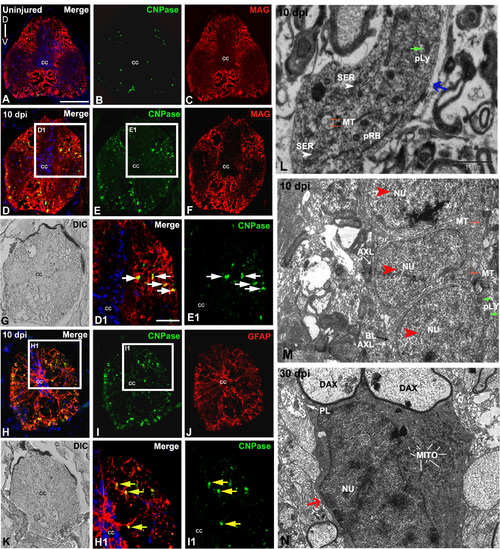
Analysis of myelinating cells in uninjured and injured zebrafish spinal cord: A-C) A transverse section of uninjured cord stained with CNPase/MAG/DAPI (A), only CNPase (B) and only MAG (C) respectively. D-G) A 10 dpi cord section stained with CNPase/MAG/DAPI (D) and only CNPase and MAG respectively (E-F) and its DIC image (G) D1) Higher magnification of boxed area in section D showing many colocalized CNPase+ and MAG+ cells (white arrows) in the white matter. E1) Higher magnification of boxed area in section E, showing CNPase+ cells (white arrows) are in the white matter. H-K) A 10 dpi cord section stained with CNPase/GFAP/DAPI (H) and only CNPase and GFAP respectively (I-J), same DIC image (K). H1) Higher magnification of boxed area in section H showing colocalized CNPase+ and GFAP+ cells (yellow arrows). I1) Higher magnification of boxed area in section I showing CNPase+ cells in the white matter. L) Ultrastructure of an oligodendrocyte in the injury site of a 10 dpi cord (blue arrow) with presence of characteristic cisternae of smooth endoplasmic reticulum (white arrowheads, SER), microtubules (MT, red arrows), primary lysosome (pLY, green arrow) and polyribosomes (pRB). Note that the cytoplasm of this oligodendrocyte is without demyelinated axon fibers hence may not actively involved in remyelination process. M) Ultrastructure of a 10 dpi cord section shows three newly formed Schwann cells (red arrowheads) with small cytoplasmic area and nucleus (NU), high N/C index, very thin intercellular spaces and basal lamina (BL, black arrow) close to axolemma (AXL, white arrow). Some cells also have microtubules (MT, red arrows) and few cytoplasmic organelles like primary lysosomes (pLY, green arrows). N) A 30 dpi cord section shows a Schwann cell (red arrow) with a prominent nucleus (NU) remyelinating two demyelinated axons (DAX) surrounded by plasmalemma (PL). The cytoplasm also contains many mitochondria (MITO). ‘cc’ denotes central canal of the cord. Scale bar = 50 µm (A-K); 20 µm (D1, E1, H1, I1); 1 µm (L, M, N). |
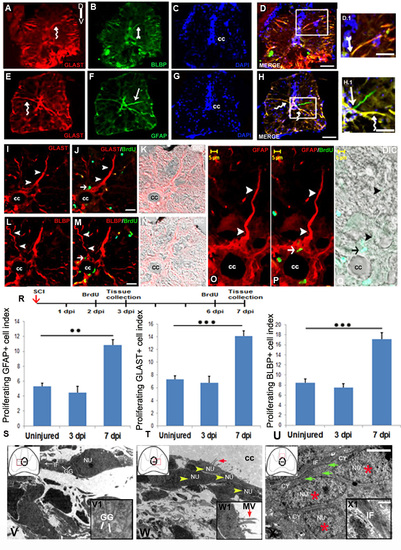
Analysis of radial glial subtypes in uninjured and injured zebrafish spinal cord: A-D) Transverse section of an uninjured cord showing GLAST+ (A, curved arrow), BLBP+ (B, arrow) radial glia counter stained with DAPI (C) and the merge picture (D). D.1) Higher magnification of boxed area of D showing radial glia colocalized with GLAST and BLBP. E-H) Transverse section of an uninjured cord showing GLAST+ (E, curved arrow), GFAP+ (F, arrow) radial glia stained with DAPI (G) and the merge image (H). H.1) Higher magnification of boxed area in section H showing a radial glia colocalized with GLAST and GFAP (curved arrow), and another radial glia stained with only GFAP (arrow). I-K) A section of 7 dpi cord showing GLAST+ radial glia (I, arrowheads), same GLAST+ radial glia colocalized with BrdU (J, small arrow) and its DIC image (K). L-N) A 7 dpi cord section showing BLBP+ radial glia (L, arrowheads), same BLBP+ radial glia colocalized with BrdU (M, small arrow) and its DIC image (N). O-Q) Higher magnification of a 7 dpi cord section showing GFAP+ radial glia with its process emerged from central canal (cc) towards pial membrane (O, arrowheads), same GFAP+ radial glia colocalized with BrdU (P, arrow) and its DIC image (Q). R) Drawing represents the time frame of SCI, BrdU treatment and tissue collection for cell proliferation experiments. S-U) Representative bar graph indicate quantification of GFAP+/BrdU+ cells (S), GLAST+/BrdU+ cells (T), BLBP+/BrdU+ cells (U) in uninjured, 3 dpi and 7 dpi cord. Values represent as mean ± s.e.m. (n = 5). Statistical significance represented as p value (Student’s t-test; **p<0.01, ***p<0.001). V and V1) Ultrastructure of a young glial progenitor cell with cytoplasmic processes containing intermediate filaments (white arrow, IF) and glycogen granules (white lines, GG) resembling radial glia in the ependymal region of a 7 dpi cord section. Inset V1 showing glycogen granules in the cytoplasm of a radial glia like cells also shown in V. W and W1) Ultrastructure of a 7 dpi cord section at the stump region shows aggregation of many ependymal cells (yellow arrowheads) with conspicuous microvilli (red arrow) protruding towards the central canal (cc). Inset W1 showing higher magnification of an ependymal cells with microvilli (MV, red arrow). X and X1) A 7 dpi cord section in the grey matter region showing many cytoplasmic processes of glia (green arrows) with compact intermediate filaments (IF) in the close vicinity of newly formed cells (red stars). Inset X1 indicating intermediate filaments in glial cytoplasm. In the insets, red boxed area inside the cartoon of injured spinal cord indicates the anatomical location of ultrastructural images. ‘NU’ and ‘CY’ denote nucleus and cytoplasm of the cell anatomy respectively. Scale bar = 50 µm (A-D, E-H); 20 µm (D.1, H.1); 15 µm (I-K, L-N); 5 µm (O-Q); 2 µm (V-X); 200 nm (V1-X1). |
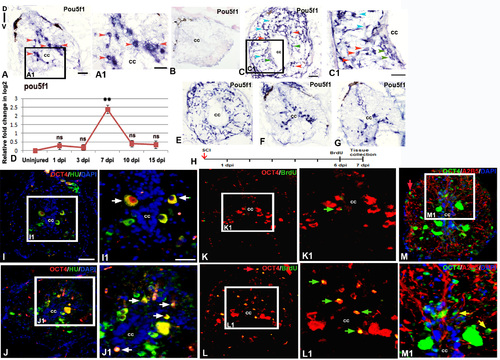
Expression of pluripotency marker in adult uninjured and injured spinal cord: A) Localization of pou5f1 transcripts in adult uninjured cord using a DIG-labeled anti-sense probe. A1) Boxed area of section A at higher magnification shows pou5f1 expression in many sub-ependymal neurons (red arrowheads). B) Lack of hybridization of a sense probe for pou5f1 in a 7 dpi cord C) A 7 dpi cord section showing presence of pou5f1 transcripts in diverse cell types like ependymal cells (green arrowheads) around the central canal (cc), Sub-ependymal neuronal cells (red arrowheads) and glial cells (blue arrowheads). C1) Same cord section at higher magnification. D) Quantitative RT-PCR of pou5f1 showing fold change (red graph) and pattern of expression at different time points after injury. Error bar indicates the value of s.e.m. (n = 3). Statistical significance of the data represented as p value (ANOVA; **P≤ 0.01, ns = not significant). E-G) Spatial differences in expression pattern of pou5f transcripts in a 7 dpi cord near injury epicenter (E), adjacent to injury epicenter (F) and away from injury epicenter (G). H) Drawing represents the time frame of SCI, BrdU treatment and tissue collection for cell proliferation experiments. I & J) Sections show OCT4 protein (encoded by the pou5f1 gene) expression along with HuC/D immunostaining in uninjured and 7 dpi cord respectively. I1 &J1) Higher magnifications of boxed area in I and J showing OCT4+ and HuC/D+ colocalized cells (white arrows). K &L) Sections show OCT4 protein expression and BrdU immunostaining in uninjured and 7 dpi cord respectively. K1 & L1) Higher magnifications of boxed area in K and L showing OCT4+ and BrdU+colocalized cells and are newly born neuron (green arrows). M) A 7 dpi cord section shows OCT4 protein expression and A2B5 immunostaining. M1) Higher magnification of boxed area in L, showing few OCT4+ and A2B5+ cells (yellow arrows). Note that in section L and M, a few OCT4+ cells are also present in pial membrane (red arrows) of the injured cord. “cc” denotes central canal of the cord in all figures. Scale bar = 50 µm (A, B, C, E, F, G, I-M); 30 µm (A1, C1); 20 µm (I1, J1, K1, L1, M1). |
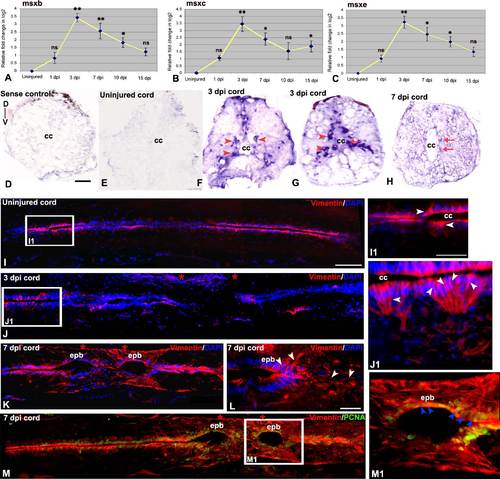
Expression of Vimentine and Msx in adult uninjured and injured spinal cord: A-C) Quantitative RT-PCR of msx-b, msx-c and msx-e expression showing fold change (yellow line graph) and temporal expression pattern after injury. Error bar indicates the value of s.e.m. (n = 3) and statistical significance represented as p value (ANOVA; **P≤ 0.01, *P≤0.05, ns = not significant). D) Lack of hybridization of a sense probe for msx-b in a 3 dpi cord. E) A transverse section of uninjured cord shows no expression of msx-b transcripts. F&G) Two representative transverse sections of 3 dpi cord shows presence of msx-b transcripts using a DIG-labeled anti-sense probe. msx-b transcripts are localized both in subependymal region, which houses mostly neurons (Hui et al., 2010) (red arrowheads) and in ependymal region around the central canal (‘cc’; red arrow). H) A 7 dpi cord section showing presence of msx-b transcripts in the ependymal cells around the central canal (‘cc’; red arrow). I) A longitudinal section of uninjured cord stained with vimentin and DAPI. I1) Higher magnification of boxed area in section I, shows vimentin positive cells (white arrowheads) present exclusively in ependyma around the central canal (cc). J) A 3 dpi cord section stained with vimentin and DAPI. Note that vimentin expression is lost in the injury epicenter (double red star) but present in normal part of the cord. J1) Higher magnification of boxed area in section J, shows many vimentin positive cells (white arrowheads) around the central canal (cc). K) A longitudinal section of 7 dpi cord showing upregulation of vimentin expression in the ependymal bulb (epb) in the injury epicenter (double red star). L) Another 7 dpi cord section showing vimentin expression (white arrowheads) in ependymal bulb (epb) and surrounding mesenchyme. M) A 7 dpi cord section stained with vimentin and PCNA. M1) Higher magnification of boxed area in section M, shows many vimentin+/PCNA+ cells (blue arrowheads) in the ependymal bulb (epb). Scale bar = 20 µm (I1, J1, M1); 50 µm (D-G, L); 100 µm (I-K, M). |
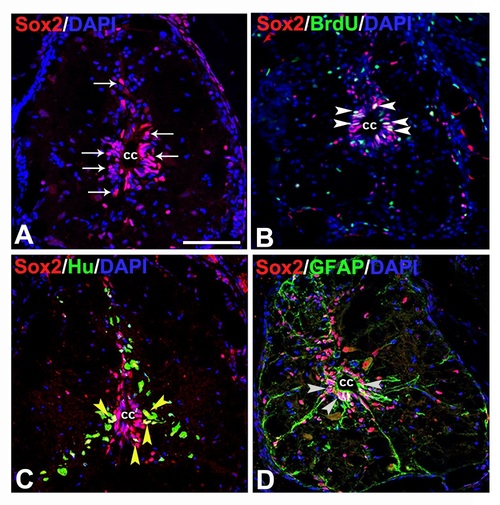
Immunohistochemical analysis of neural progenitors:A) A transverse section of 7 dpi cord showing many SOX2+ cells (white arrow)in gray matter and predominantly around the central canal (cc). B) A 7 dpi cord section shows SOX2+/BrdU+ proliferating cells (white arrowheads). C) A 7 dpi cord section stained with SOX2 and HuC/D. Subependymal region of the cord shows some colocalized SOX2+/HuC/D+ cells (yellow arrowheads). D) A 7 dpi cord section stained with SOX2 and GFAP. Some of the SOX2+ cells around central canal (cc) are also GFAP+ (grey arrowheads). Scale bar = 50 µm (A-D). |

Immunohistochemical analysis of glial progenitors:A-B) Transverse section of an uninjured cord stained with A2B5 and GFAP (A) and its corresponding DIC image (B). A1) Higher magnification of boxed area in section A showing A2B5 and GFAP colocalized cells (white arrowheads). C-D) Transverse section of a 7 dpi cord stained with A2B5 and GFAP (C) and its corresponding DIC image (D). C1) Higher magnification of boxed area in section C showing many A2B5 and GFAP colocalized cells (white arrowheads) predominantly in white matter. E-F) A 7 dpi cord section stained with A2B5 and NG2 (E) and its corresponding DIC image (F). E1) Higher magnification of boxed area of section E showing few A2B5+ and NG2+ cells (yellow arrowheads) in the white matter. ‘cc’ denotes central canal of the cord. Scale bar = 50 µm (A -F); 20 µm (A1, C1, E1). |
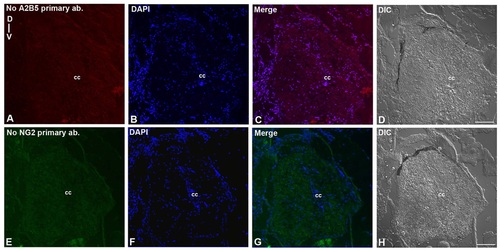
Immunohistochemistry of negative controls: A-D) Transverse section of a 7 dpi cord stained without primary antibody A2B5 for negative control in injured cord of Fig 2E. No primary antibody A2B5 (A), DAPI (B), Merge (C) and DIC (D). E-H) Transverse section of a 7 dpi cord stained without primary antibody NG2 for negative control in injured cord of Fig 2Q. No primary antibody NG2 (E), DAPI (F), Merge (G) and DIC (H). ‘cc’ denotes central canal of the cord. Scale bar = 30 µm. |
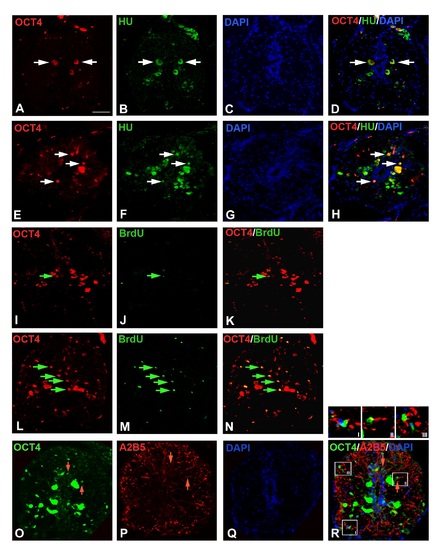
Immunohistochemical analysis of OCT4:A-D) Uninjured cord section of Fig 5I shown in separate images immunostained with OCT4, HuC/D and DAPI. E-H) The 7 dpi cord section of Fig 5J shown in separate images immunostained with OCT4, HuC/D and DAPI. I-K) Uninjured cord section of Fig 5K shown in separate images immunostained with OCT4 and BrdU. L-N) The 7 dpi cord section of Fig 5L shown in separate images immunostained with OCT4 and BrdU. O-R) The 7 dpi cord section of Fig 5M shown in separate images immunostained with OCT4, A2B5 and DAPI. The insets I, II and III in panel R, indicate three different representative OCT4 and A2B5 colocalized cells. Scale bar = 20 µm. |