
Fig. 5
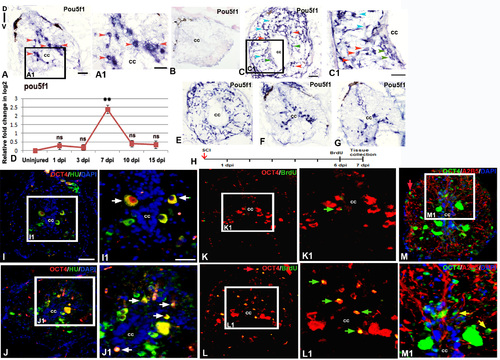
Expression of pluripotency marker in adult uninjured and injured spinal cord: A) Localization of pou5f1 transcripts in adult uninjured cord using a DIG-labeled anti-sense probe. A1) Boxed area of section A at higher magnification shows pou5f1 expression in many sub-ependymal neurons (red arrowheads). B) Lack of hybridization of a sense probe for pou5f1 in a 7 dpi cord C) A 7 dpi cord section showing presence of pou5f1 transcripts in diverse cell types like ependymal cells (green arrowheads) around the central canal (cc), Sub-ependymal neuronal cells (red arrowheads) and glial cells (blue arrowheads). C1) Same cord section at higher magnification. D) Quantitative RT-PCR of pou5f1 showing fold change (red graph) and pattern of expression at different time points after injury. Error bar indicates the value of s.e.m. (n = 3). Statistical significance of the data represented as p value (ANOVA; **P≤ 0.01, ns = not significant). E-G) Spatial differences in expression pattern of pou5f transcripts in a 7 dpi cord near injury epicenter (E), adjacent to injury epicenter (F) and away from injury epicenter (G). H) Drawing represents the time frame of SCI, BrdU treatment and tissue collection for cell proliferation experiments. I & J) Sections show OCT4 protein (encoded by the pou5f1 gene) expression along with HuC/D immunostaining in uninjured and 7 dpi cord respectively. I1 &J1) Higher magnifications of boxed area in I and J showing OCT4+ and HuC/D+ colocalized cells (white arrows). K &L) Sections show OCT4 protein expression and BrdU immunostaining in uninjured and 7 dpi cord respectively. K1 & L1) Higher magnifications of boxed area in K and L showing OCT4+ and BrdU+colocalized cells and are newly born neuron (green arrows). M) A 7 dpi cord section shows OCT4 protein expression and A2B5 immunostaining. M1) Higher magnification of boxed area in L, showing few OCT4+ and A2B5+ cells (yellow arrows). Note that in section L and M, a few OCT4+ cells are also present in pial membrane (red arrows) of the injured cord. “cc” denotes central canal of the cord in all figures. Scale bar = 50 µm (A, B, C, E, F, G, I-M); 30 µm (A1, C1); 20 µm (I1, J1, K1, L1, M1). |