
Fig. 6
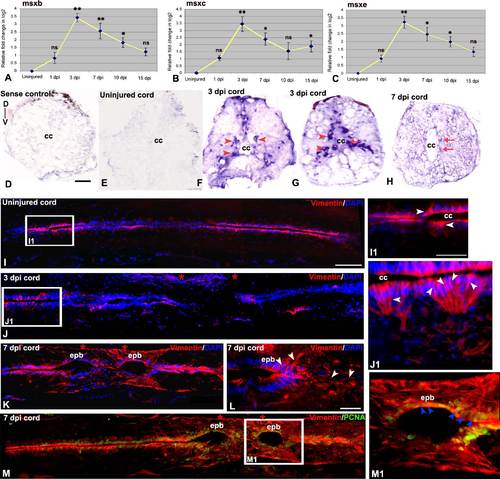
Expression of Vimentine and Msx in adult uninjured and injured spinal cord: A-C) Quantitative RT-PCR of msx-b, msx-c and msx-e expression showing fold change (yellow line graph) and temporal expression pattern after injury. Error bar indicates the value of s.e.m. (n = 3) and statistical significance represented as p value (ANOVA; **P≤ 0.01, *P≤0.05, ns = not significant). D) Lack of hybridization of a sense probe for msx-b in a 3 dpi cord. E) A transverse section of uninjured cord shows no expression of msx-b transcripts. F&G) Two representative transverse sections of 3 dpi cord shows presence of msx-b transcripts using a DIG-labeled anti-sense probe. msx-b transcripts are localized both in subependymal region, which houses mostly neurons (Hui et al., 2010) (red arrowheads) and in ependymal region around the central canal (‘cc’; red arrow). H) A 7 dpi cord section showing presence of msx-b transcripts in the ependymal cells around the central canal (‘cc’; red arrow). I) A longitudinal section of uninjured cord stained with vimentin and DAPI. I1) Higher magnification of boxed area in section I, shows vimentin positive cells (white arrowheads) present exclusively in ependyma around the central canal (cc). J) A 3 dpi cord section stained with vimentin and DAPI. Note that vimentin expression is lost in the injury epicenter (double red star) but present in normal part of the cord. J1) Higher magnification of boxed area in section J, shows many vimentin positive cells (white arrowheads) around the central canal (cc). K) A longitudinal section of 7 dpi cord showing upregulation of vimentin expression in the ependymal bulb (epb) in the injury epicenter (double red star). L) Another 7 dpi cord section showing vimentin expression (white arrowheads) in ependymal bulb (epb) and surrounding mesenchyme. M) A 7 dpi cord section stained with vimentin and PCNA. M1) Higher magnification of boxed area in section M, shows many vimentin+/PCNA+ cells (blue arrowheads) in the ependymal bulb (epb). Scale bar = 20 µm (I1, J1, M1); 50 µm (D-G, L); 100 µm (I-K, M). |