
Fig. 4
- ID
- ZDB-IMAGE-160205-18
- Publication
- Hui et al., 2015 - Characterization of Proliferating Neural Progenitors after Spinal Cord Injury in Adult Zebrafish
- All Figures
- Figures for Hui et al., 2015
|
Fig. 4
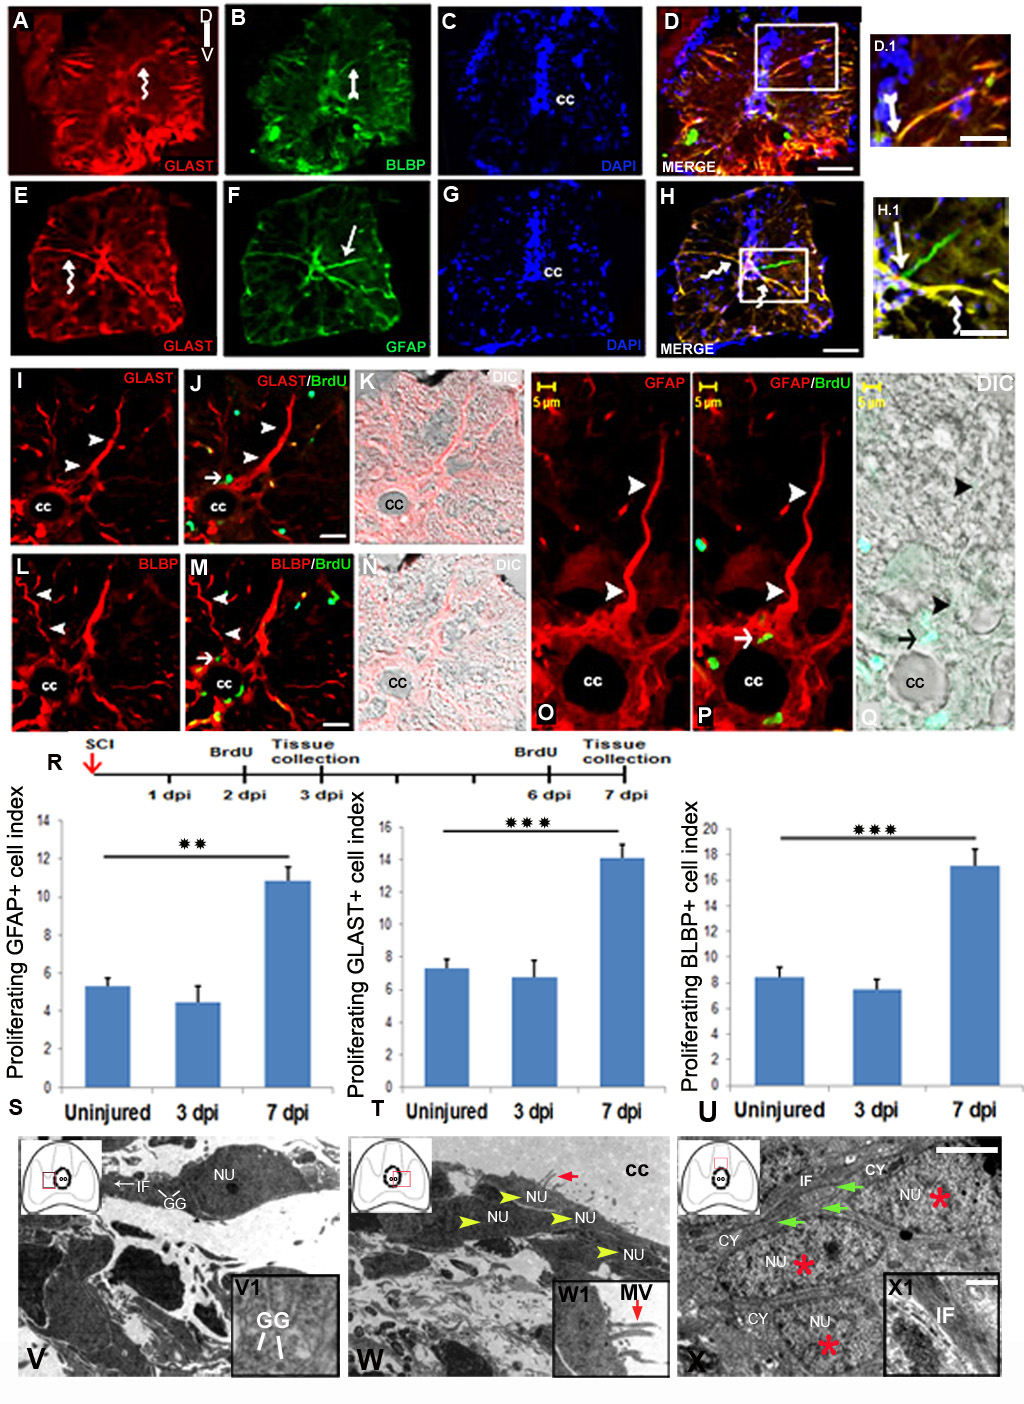
Analysis of radial glial subtypes in uninjured and injured zebrafish spinal cord: A-D) Transverse section of an uninjured cord showing GLAST+ (A, curved arrow), BLBP+ (B, arrow) radial glia counter stained with DAPI (C) and the merge picture (D). D.1) Higher magnification of boxed area of D showing radial glia colocalized with GLAST and BLBP. E-H) Transverse section of an uninjured cord showing GLAST+ (E, curved arrow), GFAP+ (F, arrow) radial glia stained with DAPI (G) and the merge image (H). H.1) Higher magnification of boxed area in section H showing a radial glia colocalized with GLAST and GFAP (curved arrow), and another radial glia stained with only GFAP (arrow). I-K) A section of 7 dpi cord showing GLAST+ radial glia (I, arrowheads), same GLAST+ radial glia colocalized with BrdU (J, small arrow) and its DIC image (K). L-N) A 7 dpi cord section showing BLBP+ radial glia (L, arrowheads), same BLBP+ radial glia colocalized with BrdU (M, small arrow) and its DIC image (N). O-Q) Higher magnification of a 7 dpi cord section showing GFAP+ radial glia with its process emerged from central canal (cc) towards pial membrane (O, arrowheads), same GFAP+ radial glia colocalized with BrdU (P, arrow) and its DIC image (Q). R) Drawing represents the time frame of SCI, BrdU treatment and tissue collection for cell proliferation experiments. S-U) Representative bar graph indicate quantification of GFAP+/BrdU+ cells (S), GLAST+/BrdU+ cells (T), BLBP+/BrdU+ cells (U) in uninjured, 3 dpi and 7 dpi cord. Values represent as mean ± s.e.m. (n = 5). Statistical significance represented as p value (Student’s t-test; **p<0.01, ***p<0.001). V and V1) Ultrastructure of a young glial progenitor cell with cytoplasmic processes containing intermediate filaments (white arrow, IF) and glycogen granules (white lines, GG) resembling radial glia in the ependymal region of a 7 dpi cord section. Inset V1 showing glycogen granules in the cytoplasm of a radial glia like cells also shown in V. W and W1) Ultrastructure of a 7 dpi cord section at the stump region shows aggregation of many ependymal cells (yellow arrowheads) with conspicuous microvilli (red arrow) protruding towards the central canal (cc). Inset W1 showing higher magnification of an ependymal cells with microvilli (MV, red arrow). X and X1) A 7 dpi cord section in the grey matter region showing many cytoplasmic processes of glia (green arrows) with compact intermediate filaments (IF) in the close vicinity of newly formed cells (red stars). Inset X1 indicating intermediate filaments in glial cytoplasm. In the insets, red boxed area inside the cartoon of injured spinal cord indicates the anatomical location of ultrastructural images. ‘NU’ and ‘CY’ denote nucleus and cytoplasm of the cell anatomy respectively. Scale bar = 50 µm (A-D, E-H); 20 µm (D.1, H.1); 15 µm (I-K, L-N); 5 µm (O-Q); 2 µm (V-X); 200 nm (V1-X1).