
Fig. 1
- ID
- ZDB-IMAGE-160205-15
- Publication
- Hui et al., 2015 - Characterization of Proliferating Neural Progenitors after Spinal Cord Injury in Adult Zebrafish
- All Figures
- Figures for Hui et al., 2015
|
Fig. 1
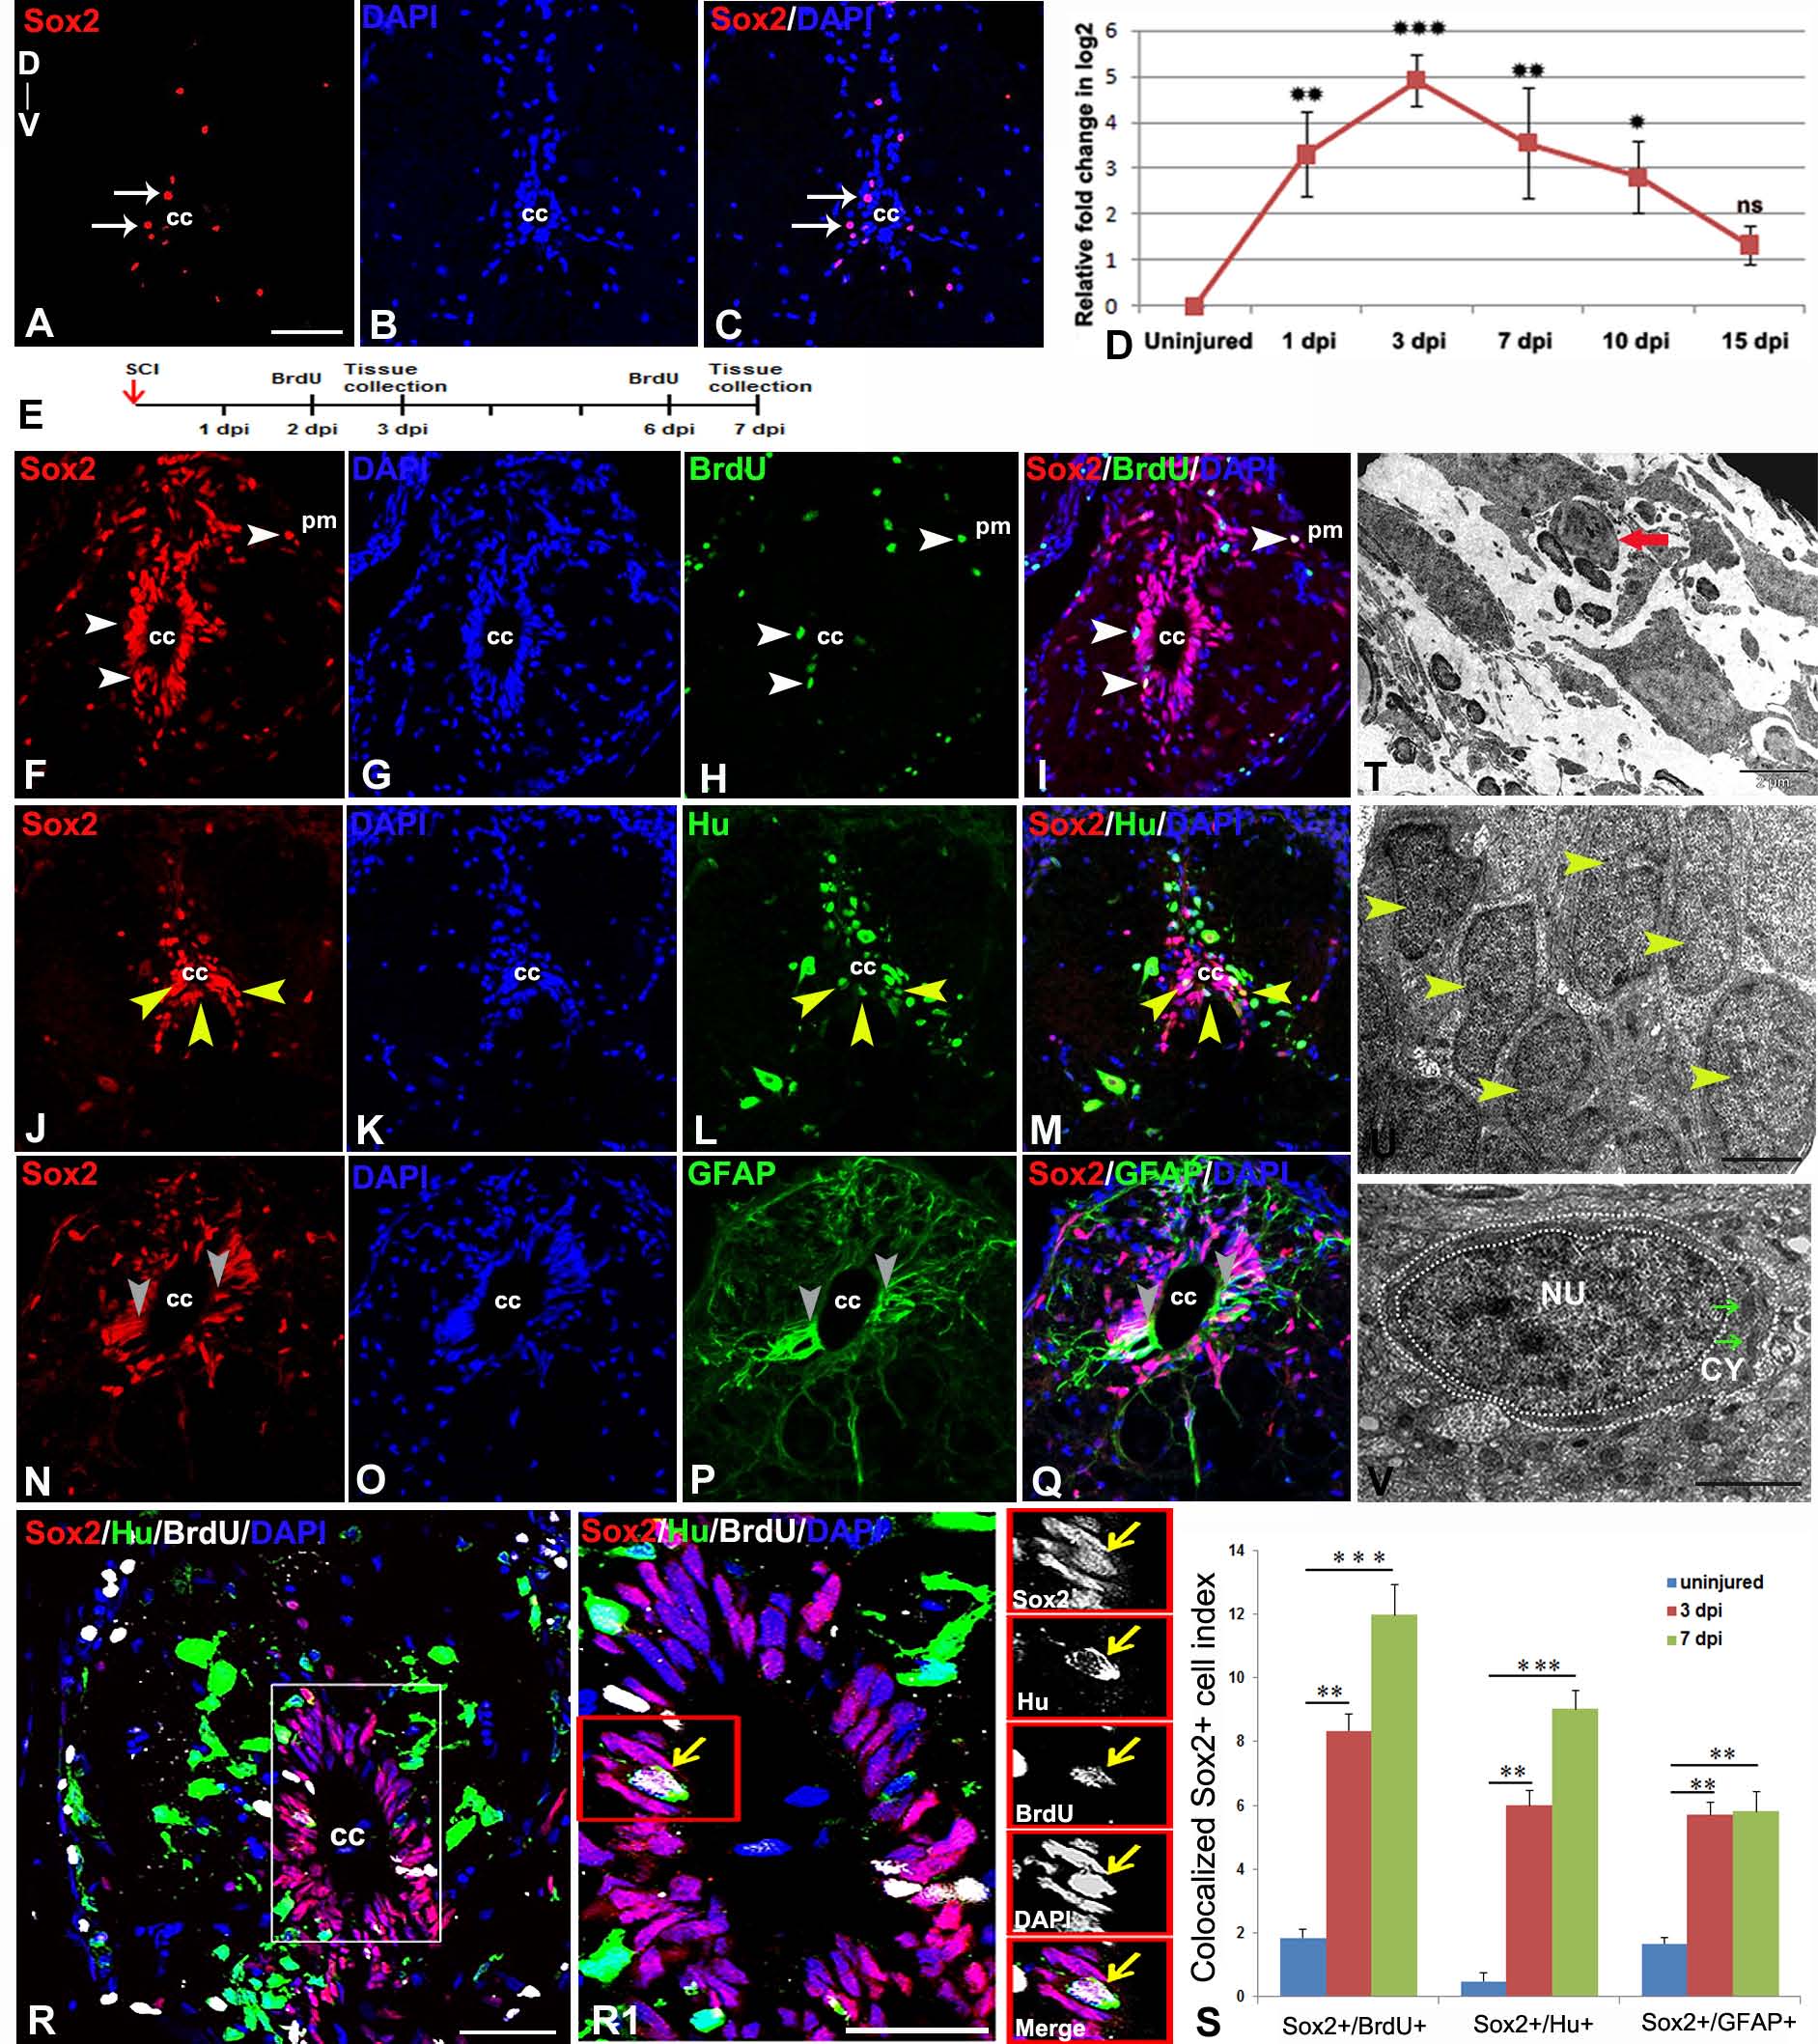
Immunohistochemical, ultrastructural and quantitative analysis of proliferating neural progenitors in injured zebrafish spinal cord: A-C) An uninjured cord section showing a few SOX2+ (A, arrow) cells in the grey matter around central canal (cc). D) Quantitative RT-PCR of sox2 expression showing fold change (red graph) and pattern of expression at different time points after injury. Error bar indicates the value of s.e.m. (n = 3) and statistical significance represented as p value (ANOVA; ***P≤0.001, **P≤ 0.01, *P≤0.05, ns = not significant). E) Drawing represents the time frame of SCI, BrdU treatment and tissue collection for cell proliferation experiments. F-I) A 3 dpi cord section shows many SOX2+positive cells in ependyma around the central canal (cc) and also near pial membrane (pm), counter stained with DAPI (G) In the same section some of the SOX2+ cells are also proliferating (H) and are SOX2+/BrdU+ (I, white arrowheads). Note that some SOX2+/BrdU+ colocalized cells are also present near pial membrane (white arrows). J-M) A 3 dpi cord section shows many SOX2+ positive cells (J, yellow arrowheads) in ependyma around the central canal (cc), counter stained with DAPI. (K) In same section some of the SOX2+ cells are colocalized with HuC/D+ cells (M, yellow arrowheads). N-Q) A 3 dpi cord section showing many SOX2+ cells (N, grey arrowheads) in the grey matter, counter stained with DAPI (O) and GFAP+ cells (P) around ependyma. Same section showing few SOX2+/GFAP+ colocalized cells (grey arrowheads) around the central canal (cc). R) A 3 dpi cord section stained with SOX2, HuC/D, BrdU and DAPI. R1) Higher magnification of boxed area in R showing a colocalized SOX2+/HuC/D+/BrdU+ cell around central canal (yellow arrow; cc). S) Bar graph indicates quantification of proliferating SOX2+ cells, SOX2+/HuC/D+ colocalized cells and SOX2+/GFAP+ colocalized cells in uninjured, 3 dpi and 7 dpi cord after crush injury. Values represent as mean ± s.e.m. (n = 5). Statistical significance represented as p value (Student’s t-test; *p<0.01, **p<0.001). T) A small sized progenitor (red arrow) with compact nucleus in the injury epicenter of a 3 dpi cord section. U) Several newly formed cells (yellow arrowheads) in the injury site of a 7 dpi cord with progenitor phenotype. V) A newly formed progenitor cell with few cytoplasmic organelles (green arrows) in the injury site of a 10 dpi cord. ‘NU’ and ‘CY’ denote nucleus and cytoplasm respectively, white dotted line demarcate the boundaries of the nucleus and the cell. The values in bar represents Mean ± s.e.m. (n = 5), statistical significance represented as p value (Student’s t-test; **p<0.01, ***p<0.001). ‘cc’ denotes central canal of the cord. Scale bar = 50 µm (A-C, F-Q), 20 µm (R), 10 µm (R1), 2 µm (T), 1 µm (U), 500 nm (V).