
IMAGE
Fig. S1
- ID
- ZDB-IMAGE-160205-21
- Publication
- Hui et al., 2015 - Characterization of Proliferating Neural Progenitors after Spinal Cord Injury in Adult Zebrafish
- All Figures
- Figures for Hui et al., 2015
Image
|
Figure Caption
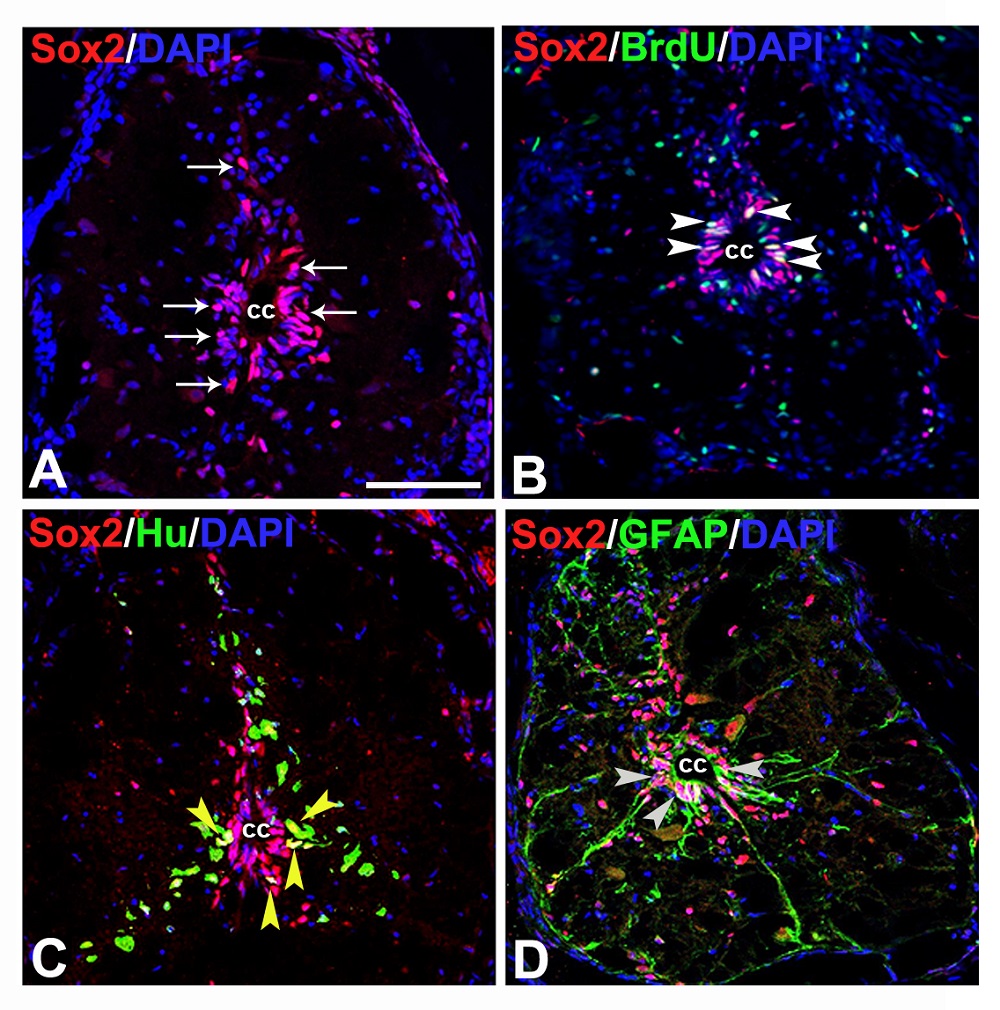
Fig. S1
Immunohistochemical analysis of neural progenitors:A) A transverse section of 7 dpi cord showing many SOX2+ cells (white arrow)in gray matter and predominantly around the central canal (cc). B) A 7 dpi cord section shows SOX2+/BrdU+ proliferating cells (white arrowheads). C) A 7 dpi cord section stained with SOX2 and HuC/D. Subependymal region of the cord shows some colocalized SOX2+/HuC/D+ cells (yellow arrowheads). D) A 7 dpi cord section stained with SOX2 and GFAP. Some of the SOX2+ cells around central canal (cc) are also GFAP+ (grey arrowheads). Scale bar = 50 µm (A-D).
Acknowledgments
This image is the copyrighted work of the attributed author or publisher, and
ZFIN has permission only to display this image to its users.
Additional permissions should be obtained from the applicable author or publisher of the image.
Full text @ PLoS One