
Fig 8
- ID
- ZDB-IMAGE-260629-145
- Genes
- Publication
- Docampo-Seara et al., 2026 - The microglia-derived protein sema4ab attenuates regenerative neurogenesis after spinal cord injury in zebrafish
- All Figures
- Figures for Docampo-Seara et al., 2026
|
Fig 8
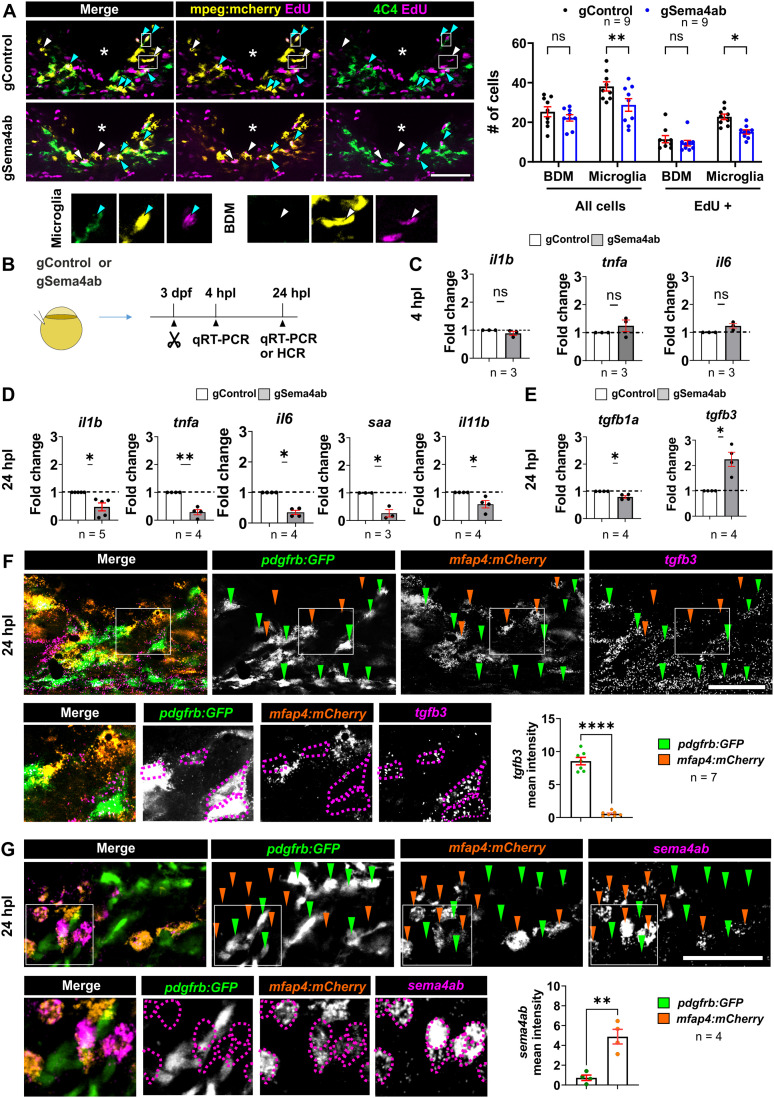
Loss of sema4ab function in microglia changes the cytokine profile of the lesion site and increases tgfb3 expression fibroblasts.
(A) There is a reduction in microglia cell number (gControl: 38.11 ± 2.3 cells per larvae, Microglia 28.78 ± 3.2 cells per larvae) but not for BDMs (gControl: 25.33 cells per larvae ± 2.5, gSema4ab: 22.22 cells per larvae ± 1.6) in sema4ab somatic mutants. The number of EdU-incorporating cells (incubation from lesion at 3 dpf to analysis at 24 hpl) is also reduced for microglia (gControl 22.8 ± 1.4 cells per larvae; gSema4ab 15.11 ± 1.1 cells per larvae), but not BDMs (gControl 11.4 ± 1.8 cells per larvae; gSema4ab 9.4 ± 1.4 cells per larvae) (Šídák’s multiple comparisons test: BDM p = 0.7388; Microglia p = 0.0077, BDM/EdU p = 0.9328, Microglia/EdU p = 0.0392). (B) A schematic indicating the experimental design for cytokine quantification by qRT-PCR is shown. (C) qRT-PCR analyses of major pro-inflammatory cytokines in sema4ab somatic mutants show no differences to injured control gRNA-injected larvae at 4 hpl (One-sample t test; il1b: p = 0.2526; tnfa: p = 0.3623; il6: p = 0.1028). (D) At 24 hpl, sema4ab somatic mutants show decreased expression levels of pro-inflammatory cytokines and markers (One-sample t test; il1b: −2.12 fold-change, p = 0.0212; tnfa: −3.58 fold-change, p = 0.0047; il6: −2.94 fold-change, p = 0.0024; saa: −3.84 fold-change, p = 0.0311; il11b: −1.73 fold-change, p = 0.0495). (E) While the anti-inflammatory cytokine tgfb1a shows a slight decrease (−1.26 fold-change, One-sample t test; p = 0.0251), tgfb3 is substantially increased in expression in sema4ab somatic mutants (+2.24 fold-change, One-sample t test; p = 0.0210). (F) HCR-FISH against tgfb3 in the pdgfrb:GFP × mfap4:mCherry double transgenic line shows expression of tgfb3 in pdgfrb:GFP+ cells (green arrowheads) and hardly in mfap4:mCherry+ cells (orange arrowheads) (pdgfrb:GFP: 8.557 [a.u]; mfap4:mCherry: 0.5726 [a.u]; Unpaired t test: p < 0.0001). Purple dotted circles point at tgfb3-expressing cells. (G) HCR-FISH against sema4ab in the the pdgfrb:GFP × mfap4:mCherry double transgenic line shows hardly any expression of sema4ab in pdgfrb:GFP+ cells (green arrowheads), but in mfap4:mCherry+ cells (orange arrowheads) (pdgfrb:GFP: 0.7313 [a.u]; mfap4:mCherry: 4.883 [a.u]; Unpaired t test: p = 0.0019). Purple dotted circles point at sema4ab-expressing cells. Each dot for qRT-PCR represents a pool of 50 larvae. β-actin was used as housekeeping gene. Raw data for qRT-PCR can be found in S5 and S6 Data. Error bars show SEM. Scale bars: 50 µm. Data files for graphs available in S2 Data.