
IMAGE
Figure 7
- ID
- ZDB-IMAGE-251226-13
- Genes
- Publication
- Fan et al., 2025 - Bcl3 Deficiency Leads to Hyperinflammation in Zebrafish
- All Figures
- Figures for Fan et al., 2025
Image
|
Figure Caption
Figure 7
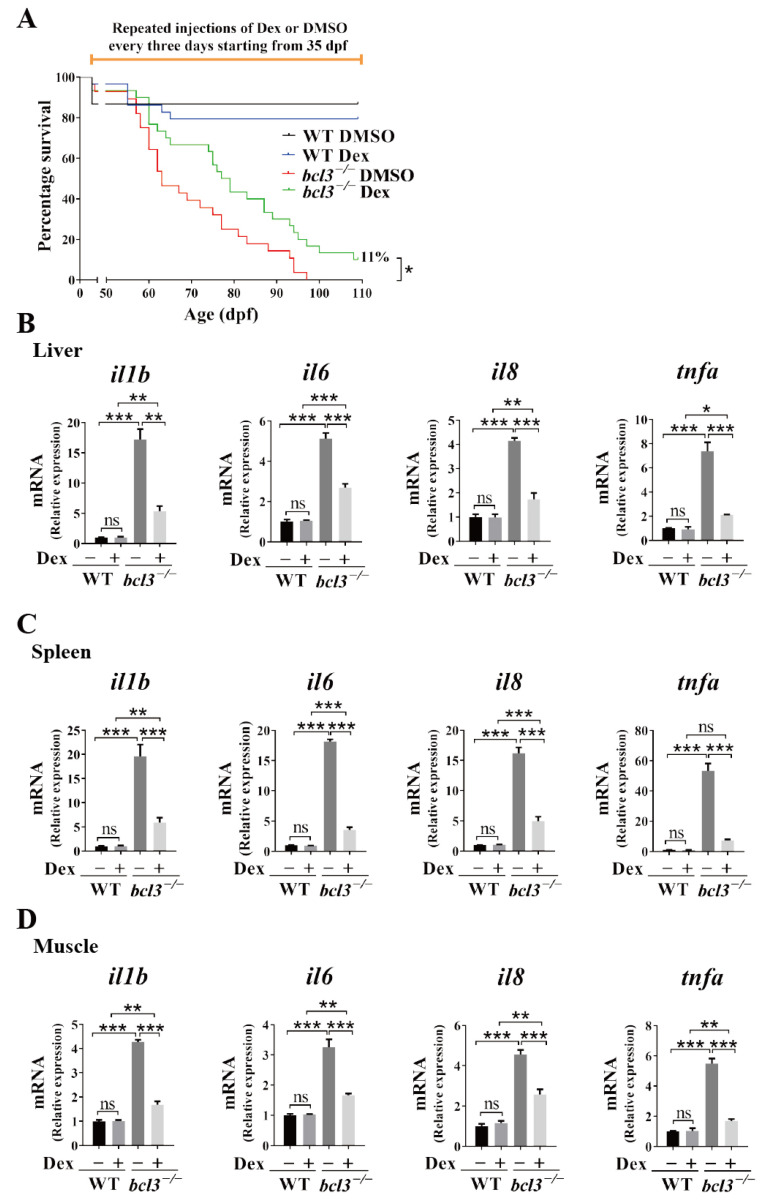
Effects of Dex treatment in adult
Figure Data
Acknowledgments
This image is the copyrighted work of the attributed author or publisher, and
ZFIN has permission only to display this image to its users.
Additional permissions should be obtained from the applicable author or publisher of the image.
Full text @ Cells