
Fig. 3
|
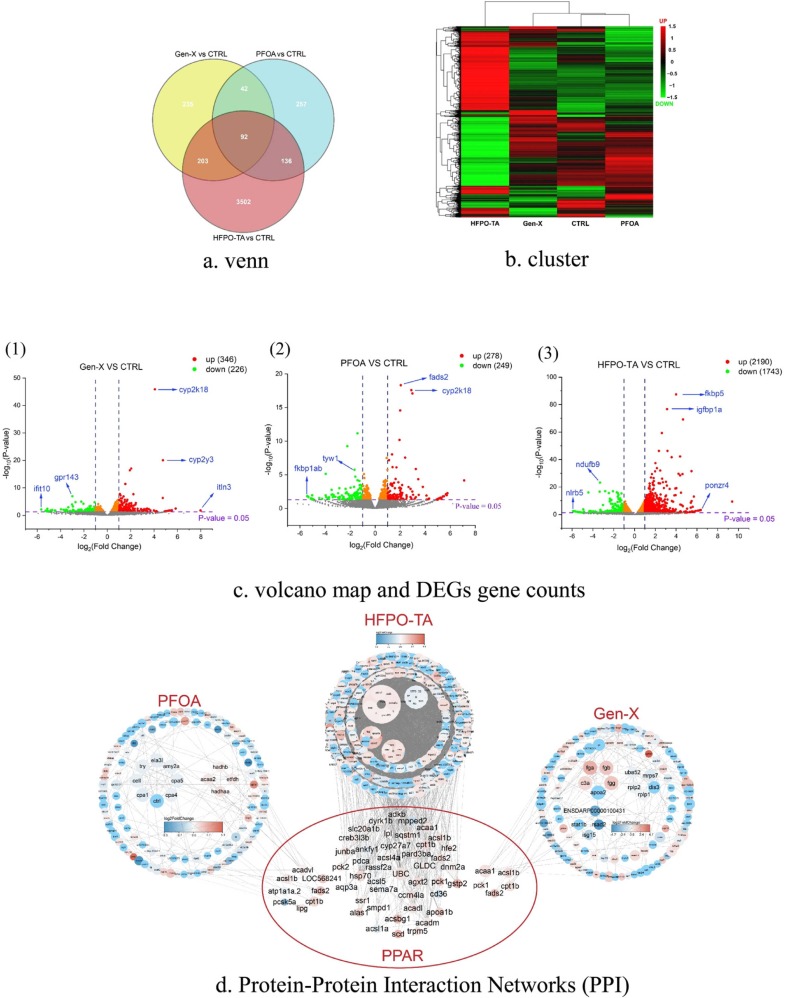
Fig. 3 Differential gene analysis of zebrafish exposed to PFOA and its alternatives at 72 hpe. (a) shows the number of shared and unique differential genes between different groups. The heat map indicates the distribution of up- and down-regulated genes and cluster analysis, with up-regulation in red and down-regulation in green (b); Volcano plots indicate the number and distribution of differential genes for PFOA, Gen-X, and HFPO-TA compared with the control group, with blue genes labeled as genes with larger P values or foldchange (c1, 2, 3); Protein-Protein Interaction Networks (PPI) was drawn after 72 hpe exposure of zebrafish with PFOA and its alternatives (d). The STRING database was used to draw PPI, and the most enriched network nodes were screened by MCODE, and the size of nodes was defined by betweenness.