
IMAGE
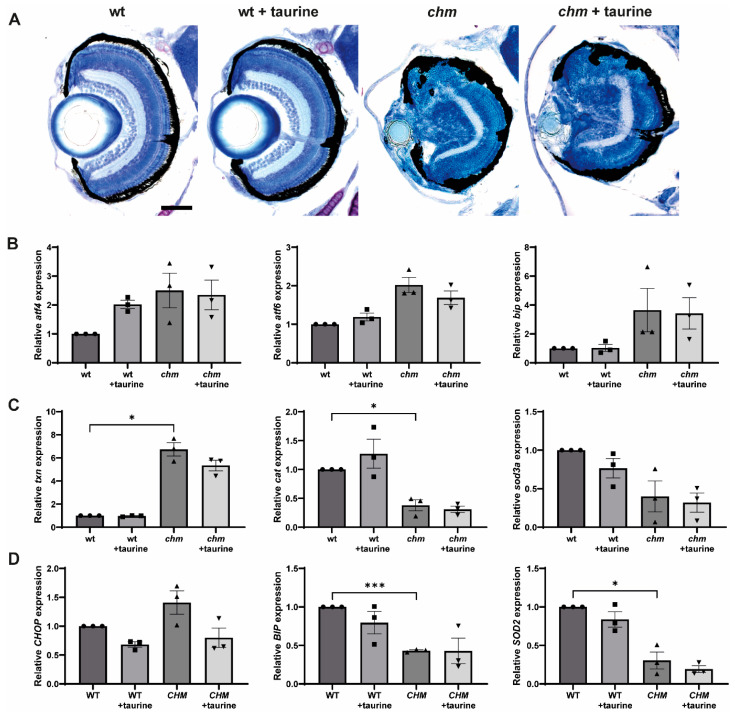
Figure 4
- ID
- ZDB-IMAGE-231002-365
- Genes
- Publication
- Sarkar et al., 2023 - Oxidative and Endoplasmic Reticulum Stress Represent Novel Therapeutic Targets for Choroideremia
- All Figures
- Figures for Sarkar et al., 2023
Image
|
Figure Caption
Figure 4
Analysis of ER stress in taurine-treated
Figure Data
Acknowledgments
This image is the copyrighted work of the attributed author or publisher, and
ZFIN has permission only to display this image to its users.
Additional permissions should be obtained from the applicable author or publisher of the image.
Full text @ Antioxidants (Basel)