
IMAGE
Fig. 5
- ID
- ZDB-IMAGE-230810-5
- Genes
- Publication
- Yao et al., 2023 - DExH/D RNA helicase 15 regulates zebrafish intestinal development through the Wnt signaling pathway
- All Figures
- Figures for Yao et al., 2023
Image
|
Figure Caption
Fig. 5
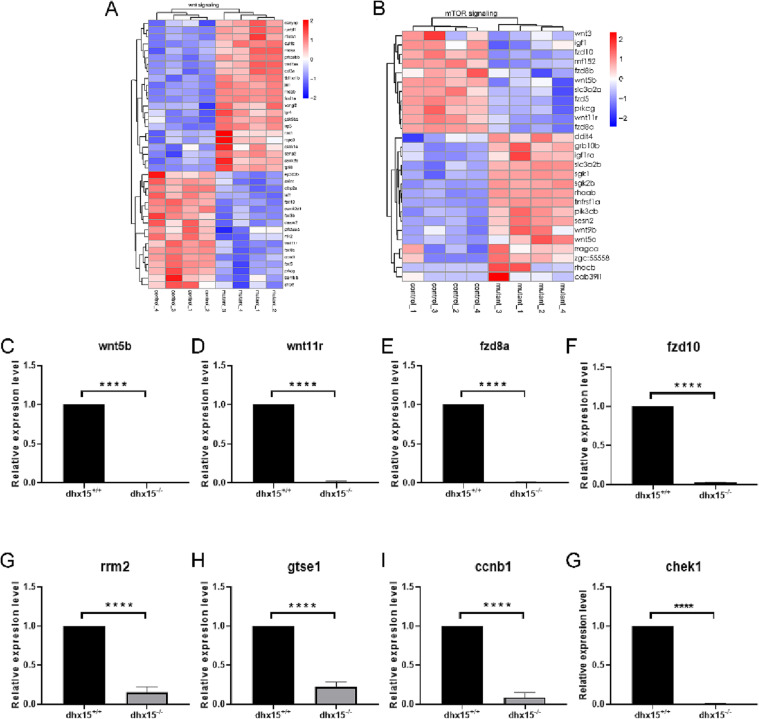
Fig. 5. Dhx15 may regulate intestinal development through the Wnt signal pathway. (A-B) Heat map analysis of the hierarchical clustering of DEGs in the Wnt signaling pathway (A) and the mTOR signaling pathway (B). (C-G) qRT-PCR analysis of wnt5b, wnt11r, fzd8a, fzd10, rrm2, gtse1, ccnb1, and chek1 in dhx15+/+ and dhx15−/− zebrafish at 3.5 dpf. Each qRT-PCR experiment was carried out in triplicates. qRT- PCR, quantitative real- time PCR. DEGs: differentially expressed genes.
Figure Data
Acknowledgments
This image is the copyrighted work of the attributed author or publisher, and
ZFIN has permission only to display this image to its users.
Additional permissions should be obtained from the applicable author or publisher of the image.
Full text @ Genomics