
Fig. 6.
- ID
- ZDB-IMAGE-230503-7
- Genes
- Publication
- Truong et al., 2023 - PRDM1 DNA-binding zinc finger domain is required for normal limb development and is disrupted in split hand/foot malformation
- All Figures
- Figures for Truong et al., 2023
|
Fig. 6.
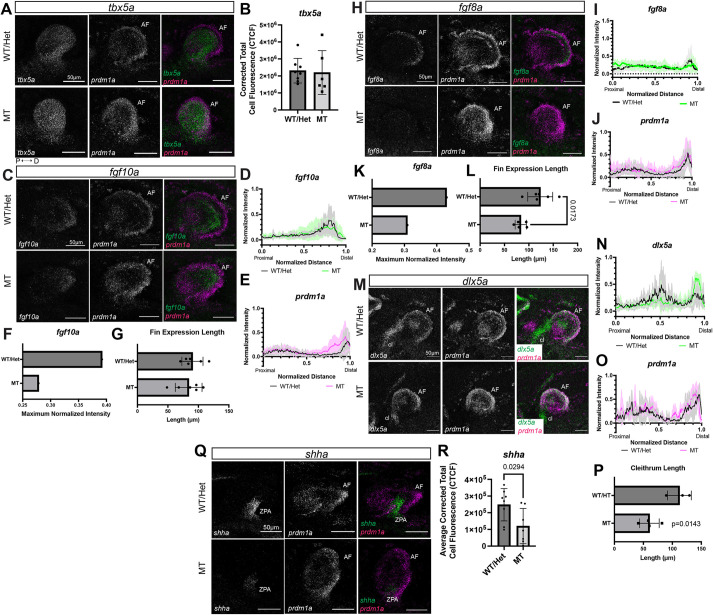
Prdm1a acts downstream of fin initiation and regulates Fgf signaling in the fin mesenchyme required for outgrowth and anterior/posterior patterning. (A,C,H,M,Q) Lateral views of pectoral fins from whole-mount WT and prdm1a−/− mutant embryos after hybridization chain reaction (HCR) was performed at 48 hpf. Scale bars: 50 µm. (A) tbx5a (pectoral fin initiation) and prdm1a expression (n=8 WT and 6 prdm1a−/− embryos). (B) Quantification of tbx5a expression using corrected total cell fluorescence (CTCF) showed no significant difference. (C) fgf10a (pectoral fin induction) and prdm1a expression (n=6 for each genotype). (D,E) Quantification of (D) fgf10a and (E) prdm1a expression along a line drawn from the most proximal to the most distal point of the fin bud using the line scan tool on ImageJ. Intensity and distance were normalized between 0 and 1. (F) Maximum normalized intensity of fgf10a shows a decrease in prdm1a−/− compared to WT embryos. (G) Length of the fin as measured by fgf10a gene expression. (H) fgf8a (AF outgrowth marker) and prdm1a expression (n=6 for each genotype). (I,J) Quantification of (I) fgf8a and (J) prdm1a expression along a line drawn from the most proximal to the most distal point of the fin bud. (K) Maximum normalized intensity of fgf8a shows a decrease in prdm1a−/− compared to WT embryos. (L) Length of the fin as measured by fgf8a gene expression. (M) dlx5a (outgrowth marker) and prdm1a expression (n=3 WT and 4 prdm1a−/− embryos). (N,O) Quantification of (N) dlx5a and (O) prdm1a expression along a line drawn from the most proximal to the most distal point of the fin bud. (P) Length of the cleithrum is decreased in prdm1a−/− compared to WT embryos (P=0.0143). (Q) shha (anterior/posterior patterning) and prdm1a expression (n=8 for each genotype). (R) Expression of shha was quantified using CTCF shows a decrease in prdm1a−/− compared to WT embryos (P=0.0294). Solid lines in line intensity graphs represent the mean±s.d. Statistical comparisons were made using unpaired, two-tailed, independent Student's t-test. All images are maximum projections of lateral views of the pectoral fin. The background was subtracted using the rolling ball feature in ImageJ (50 pixels). AF, apical fold; cl, cleithrum; CTCF, corrected total cell fluorescence; D, distal; hpf, hours post fertilization; P, proximal; ZPA, zone of polarizing activity.