
Fig. 6
- ID
- ZDB-IMAGE-220926-14
- Genes
- Publication
- Zoodsma et al., 2022 - Disruption of grin2B, an ASD-associated gene, produces social deficits in zebrafish
- All Figures
- Figures for Zoodsma et al., 2022
|
Fig. 6
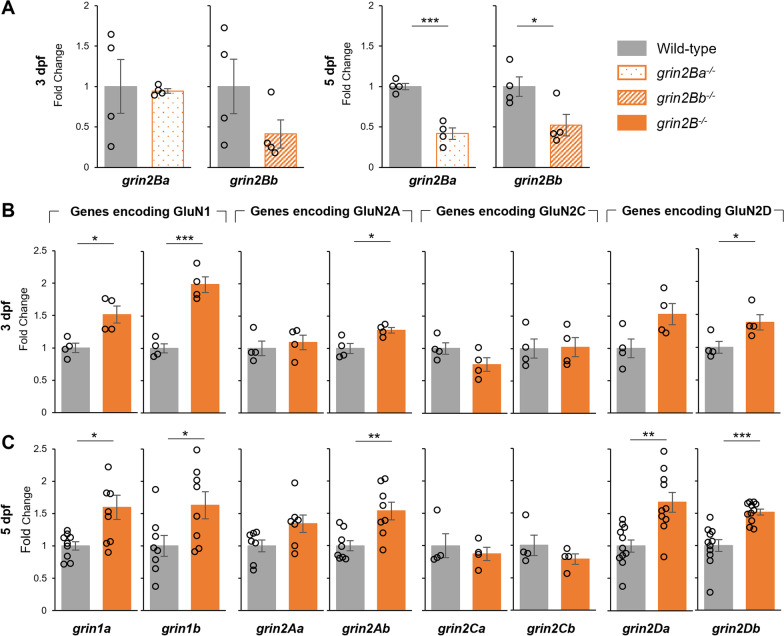
Nonsense-mediated decay and compensatory changes in NMDAR subunit expression in grin2B−/−. A Relative rt-qPCR expression levels at grin2Ba at 3 dpf (n = 4, 4) and 5 dpf (n = 4, 4; ***p = 3.5e−4) for wild-type controls and grin2Ba single mutants, respectively, and of grin2Bb at 3 dpf (n = 4, 4) and 5 dpf (n = 4, 4; *p = 0.037) for wild-type controls and grin2Bb single mutants, respectively. B Relative rt-qPCR expression levels at 3 dpf of grin1a (n = 4, 4; *p = 0.013), grin1b (n = 4, 4; ***p = 9.4e−4), grin2Aa (n = 4, 4), grin2Ab (n = 4, 4; *p = 0.026), grinCa (n = 4, 4), grinCb (n = 4, 4), grinDa (n = 4, 4), and grinDb (n = 4, 4; *p = 0.041) for wild type and grin2B−/−, respectively. C Relative rt-qPCR expression levels at 3 dpf of grin1a (n = 9, 9; *p = 0.013), grin1b (n = 8, 8; *p = 0.033), grin2Aa (n = 7, 7), grin2Ab (n = 8, 8; **p = 0.0061), grinCa (n = 4, 4), grinCb (n = 4, 4), grinDa (n = 11, 10; **p = 0.0018), and grinDb (n = 11, 11; ***p = 1.5e−4) for wild type and grin2B−/−, respectively