
IMAGE
Fig. 5
Image
|
Figure Caption
Fig. 5
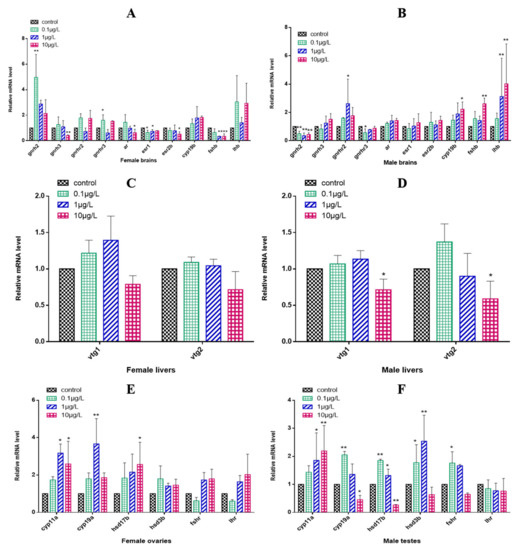
Figure 5. Transcription of HPGL axis-related genes in F0 zebrafish after 150 days of exposure to CyB. Females: (A) brain, (C) liver, (E) gonads; Males: (B) brain, (D) liver, (F) gonads. The results are presented as the mean ± SD of three replicates (* p < 0.05; ** p < 0.01).
Figure Data
Acknowledgments
This image is the copyrighted work of the attributed author or publisher, and
ZFIN has permission only to display this image to its users.
Additional permissions should be obtained from the applicable author or publisher of the image.
Full text @ Toxics