
Fig. 7
- ID
- ZDB-IMAGE-220607-34
- Genes
- Publication
- Varela et al., 2022 - Cdkl5 mutant zebrafish shows skeletal and neuronal alterations mimicking human CDKL5 deficiency disorder
- All Figures
- Figures for Varela et al., 2022
|
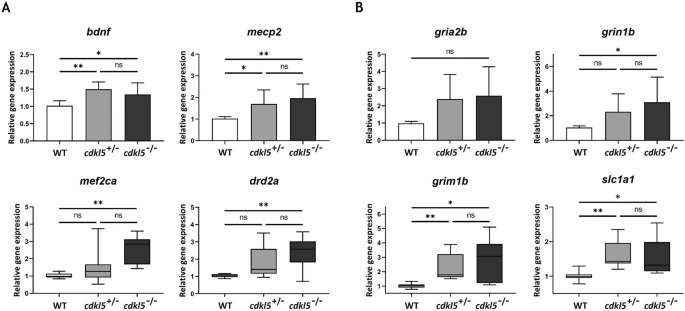
Fig. 7
Molecular analysis of cdkl5sa21938 mutants. Relative gene expression analysis of neuronal markers (A), including glutamatergic neurotransmission markers (B) in wild-type (WT), heterozygous (cdkl5+/−), and homozygous (cdkl5−/−) mutant zebrafish embryos at 5 dpf, measured by qPCR. For bdnf, mecp2, gria2b and grin1b, values are presented as mean ± SD and statistical analysis was performed using one-way ANOVA followed by Tukey’s test. For mef2ca, drd2a, grim1b and slc1a1, data are presented as median with interquartile range and statistical analysis was performed using Kruskal–Wallis followed by Dunn multiple comparisons test. At least three independent experiments were performed. *, and ** indicate p < 0.05 and p < 0.01, respectively. ns indicates not significant.