
FIGURE 5
|
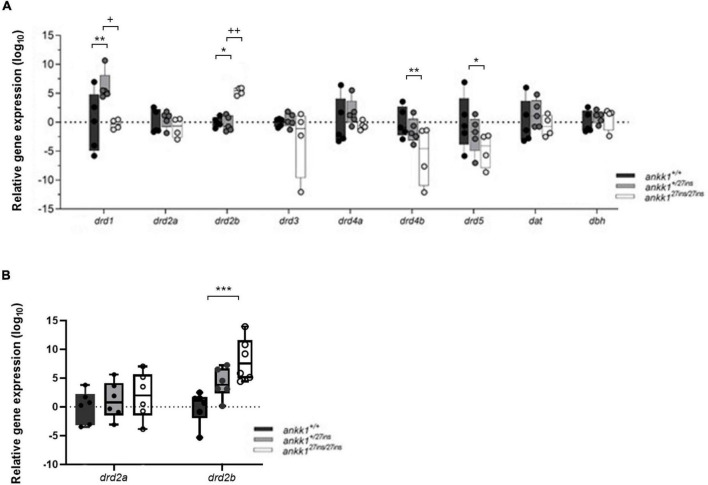
FIGURE 5
Quantification of dopaminergic gene expression. (A) Expression levels of drd2a, drd2b, drd1, drd3, drd4a, drd4b, drd5, dat, and dbh in 5 days post fertilization zebrafish larvae (ankk1+/+, ankk1+/27ins, and ankk127ins/27ins) measured by qPCR. Each dot represents a pool of larvae (ntotal = 80 larvae: 5 samples consisting of 16 larvae for ankk1+/+ and ankk1+/27ins, and 4 samples consisting of 16 larvae for each sample (ankk127ins/27ins). (B) Expression levels of drd2a and drd2b in adult zebrafish whole brains. Each dot represents a single brain. Data are shown in box-whiskers plot (5–95 percentile). Legend: *p < 0.05 versus ankk1+/+; **p < 0.01 versus ankk1+/+; ***p < 0.0001 versus ankk1+/+; +p < 0.05 versus corresponding ankk1+/27ins; ++p < 0.01 versus corresponding ankk1+/27ins. Statistics for gene expression data and P value adjustment are provided in Supplementary Tables 2, 3.