
IMAGE
Figure 3
Image
|
Figure Caption
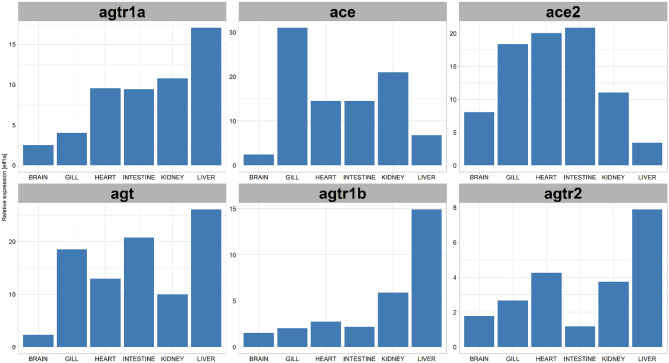
Figure 3
RAAS pathway gene expression displays tissue-specific enrichment. The relative expression levels of agtr1a, ace, ace2, agt, agtr1b, and agtr2 to elf1a1 in different organs of wild type adult zebrafish (n = 6). agt: Angiotensinogen, agtr1b: Type-1B angiotensin II receptor, agtr2: Type-2 Angiotensin II Receptor, agtr1a: Type-1A angiotensin II receptor, ace: Angiotensin-converting enzyme 1, ace2: Angiotensin-converting enzyme 2.
Figure Data
Acknowledgments
This image is the copyrighted work of the attributed author or publisher, and
ZFIN has permission only to display this image to its users.
Additional permissions should be obtained from the applicable author or publisher of the image.
Full text @ Sci. Rep.