
Fig. 4
- ID
- ZDB-IMAGE-200217-3
- Genes
- Publication
- Singh et al., 2019 - αKlotho Regulates Age-Associated Vascular Calcification and Lifespan in Zebrafish
- All Figures
- Figures for Singh et al., 2019
|
Fig. 4
Pathway Enrichment Analysis of Differentially Upregulated Genes
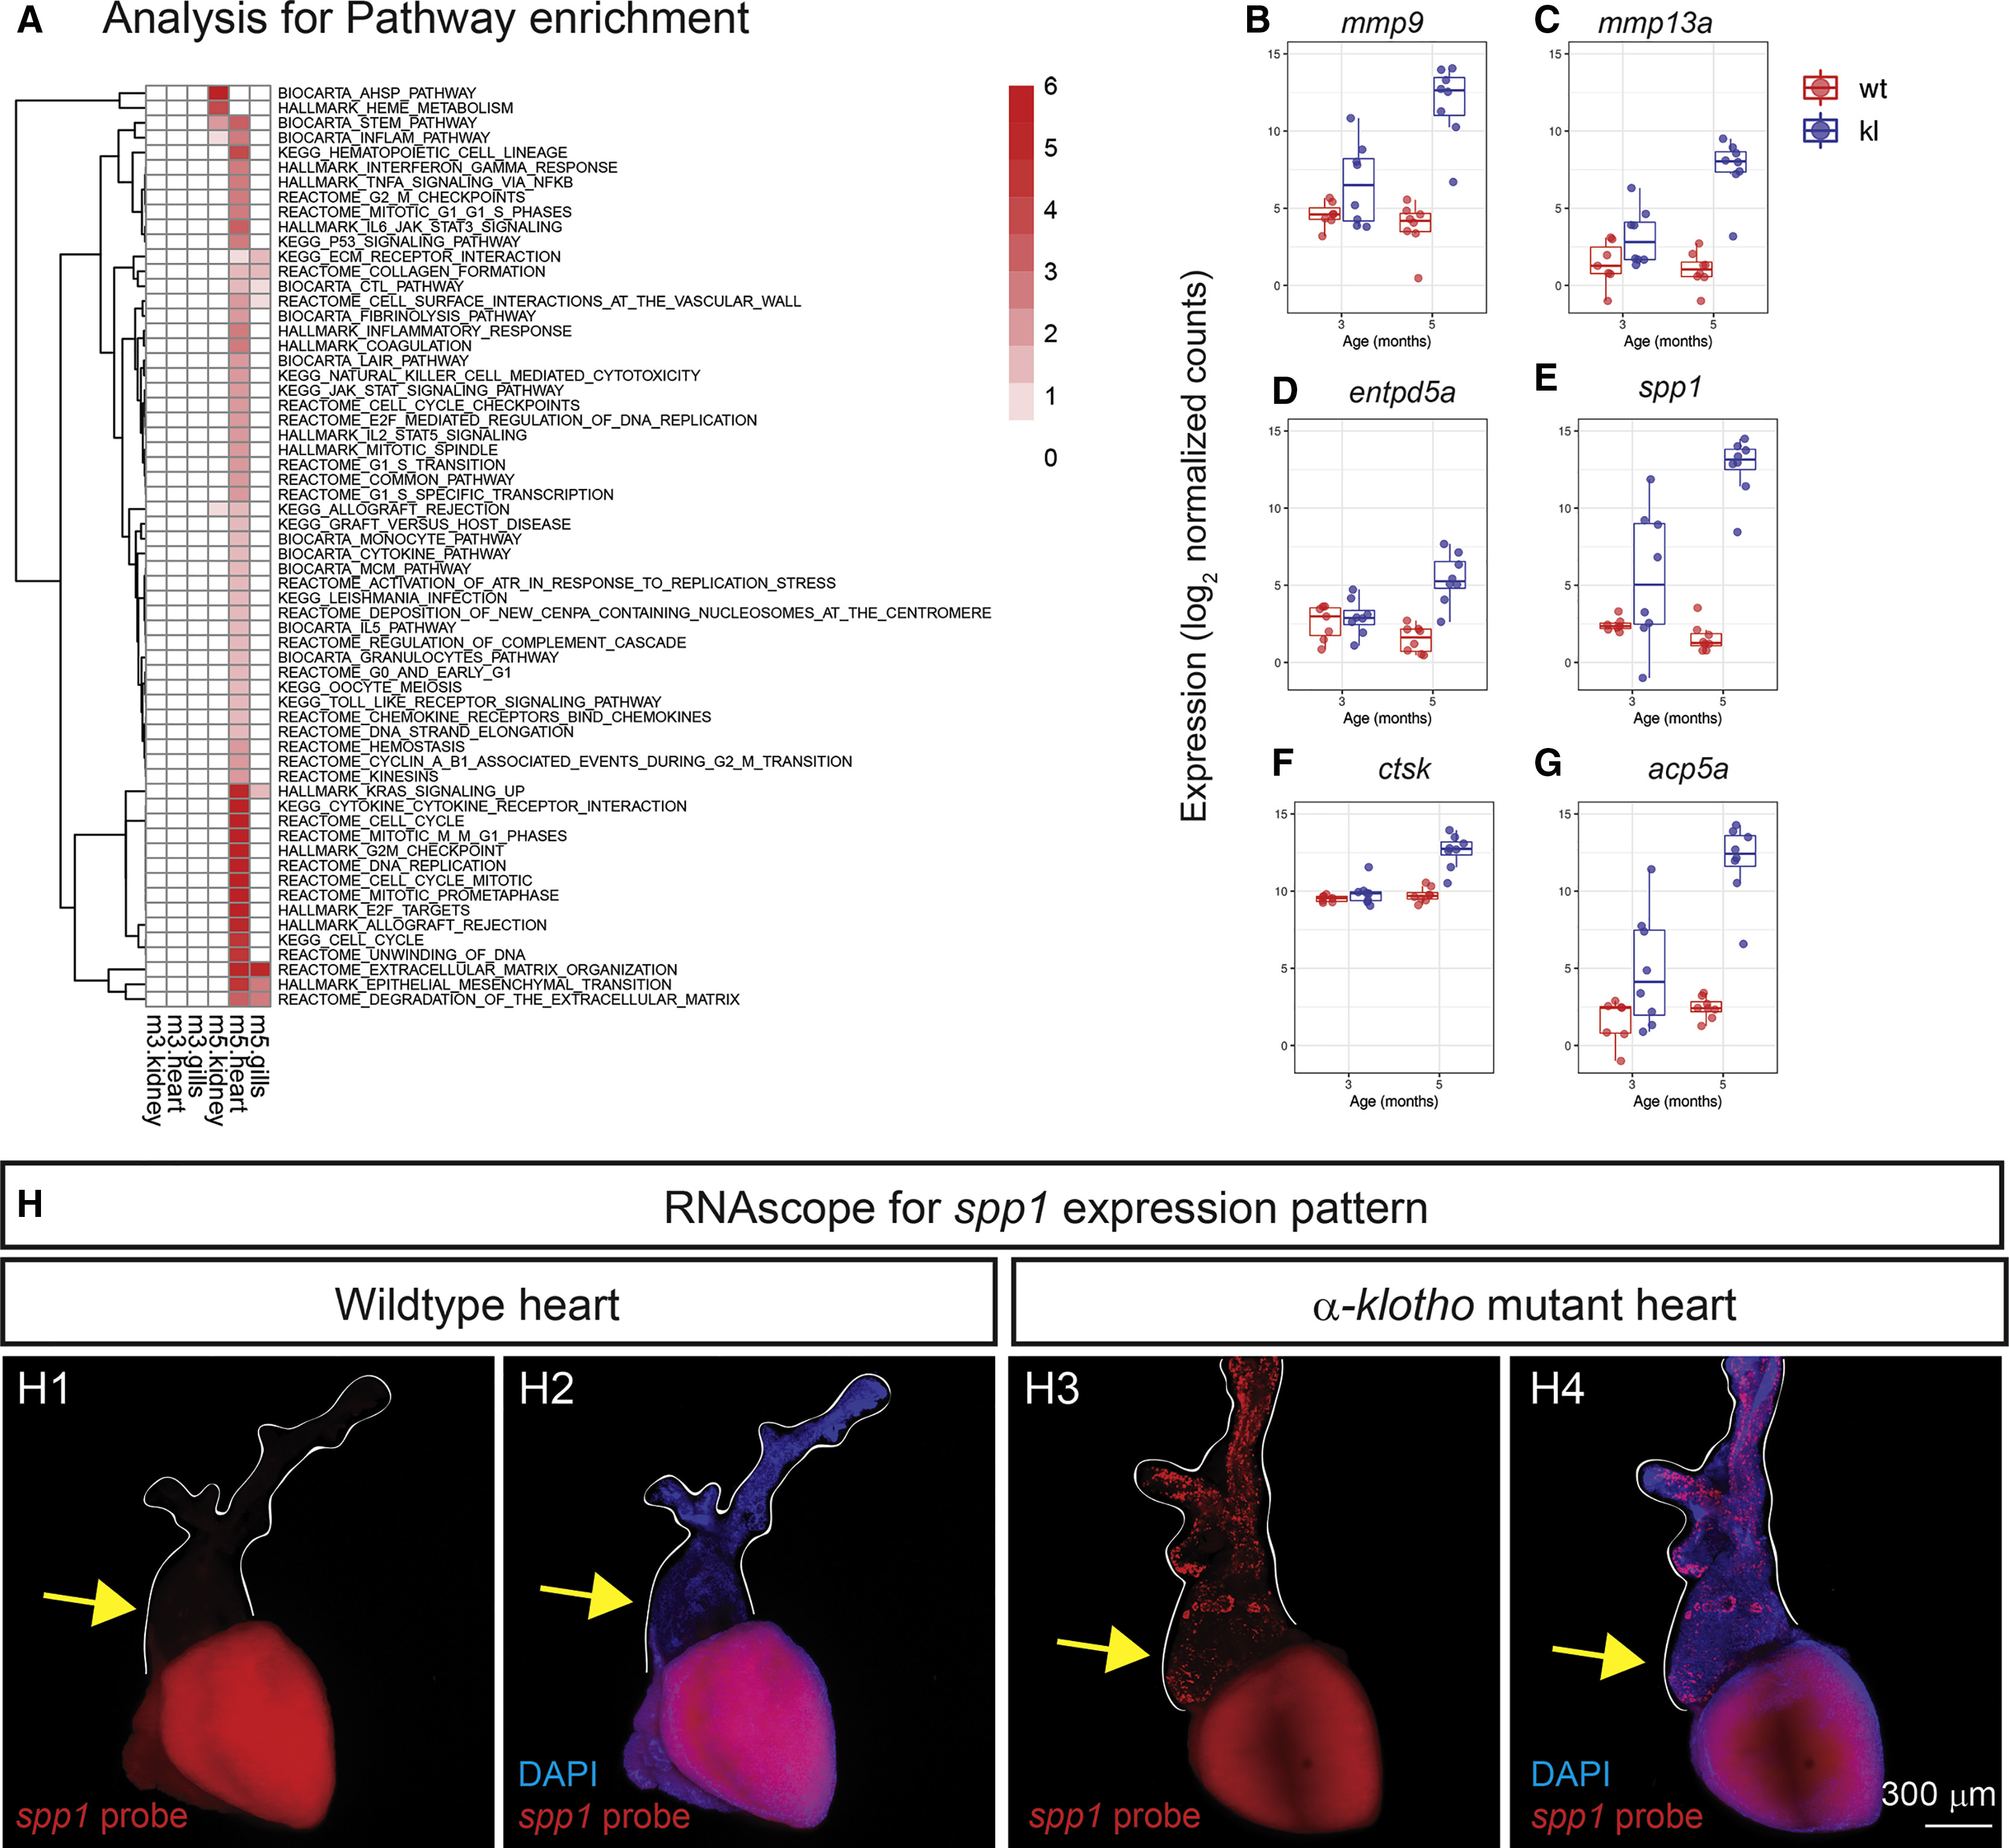
(A) Gene set enrichment analysis comparing upregulated pathways by αklotho mutation in the kidney, heart, and gills. Each row is a pathway, annotated on the right-hand side, and each column corresponds to the significance of the enrichment analysis for each tissue and adult stage (m3, 3 mpf; m5, 5 mpf). The colors from white to red represent the negative log10 adjusted p value from low to high. Only pathways that were enriched significantly (adjusted p value < 0.05) in at least one tissue were included.
(B–G) Box plots showing select examples of genes upregulated at 5 mpf in αklotho mutant hearts (blue, kl) compared to wild-type (WT) siblings (red). Shown are (B) mmp9 (matrix metallopeptidase 9), (C) mmp13a (matrix metallopeptidase 13a), (D) entpd5a (ectonucleoside triphosphate diphosphohydrolase 5a), (E) spp1 (secreted phosphoprotein 1), (F) ctsk (cathepsin K), and (G) acp5a (acid phosphatase 5a, tartrate resistant). Age: 3 and 5 mpf.
(H) RNAscope for spp1: (H1 and H2) WT control; (H3 and H4) αklotho (klΔ5) mutant hearts stained with DAPI (blue), and spp1RNAscope probe (red). White lines outline the BA (arrow) and the blood vessel leading to gills.