
Figure 5
- ID
- ZDB-IMAGE-191230-823
- Genes
- Publication
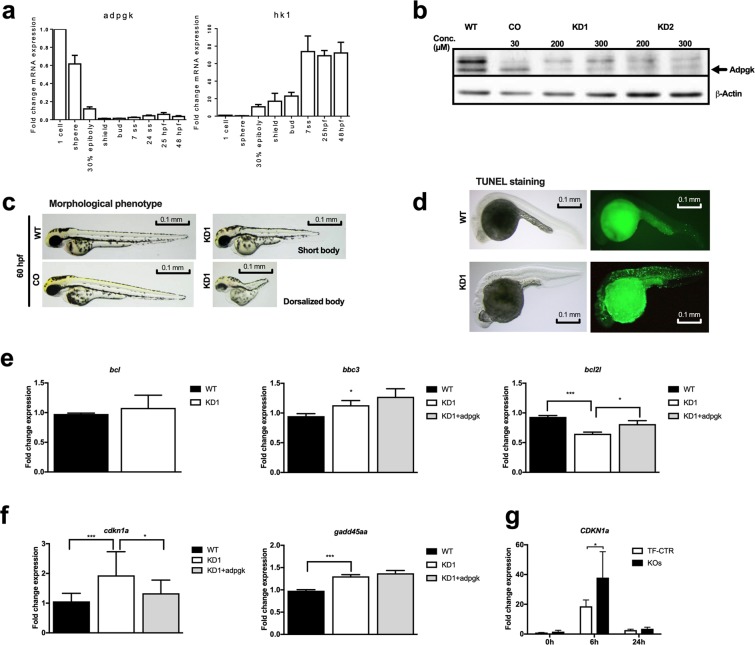
- Imle et al., 2019 - ADP-dependent glucokinase regulates energy metabolism via ER-localized glucose sensing
- All Figures
- Figures for Imle et al., 2019
|
Figure 5
Knockdown of Adpgk in embryonic zebrafish results in aberrant body axis development and cell death.