
IMAGE
Fig. 4
Image
|
Figure Caption
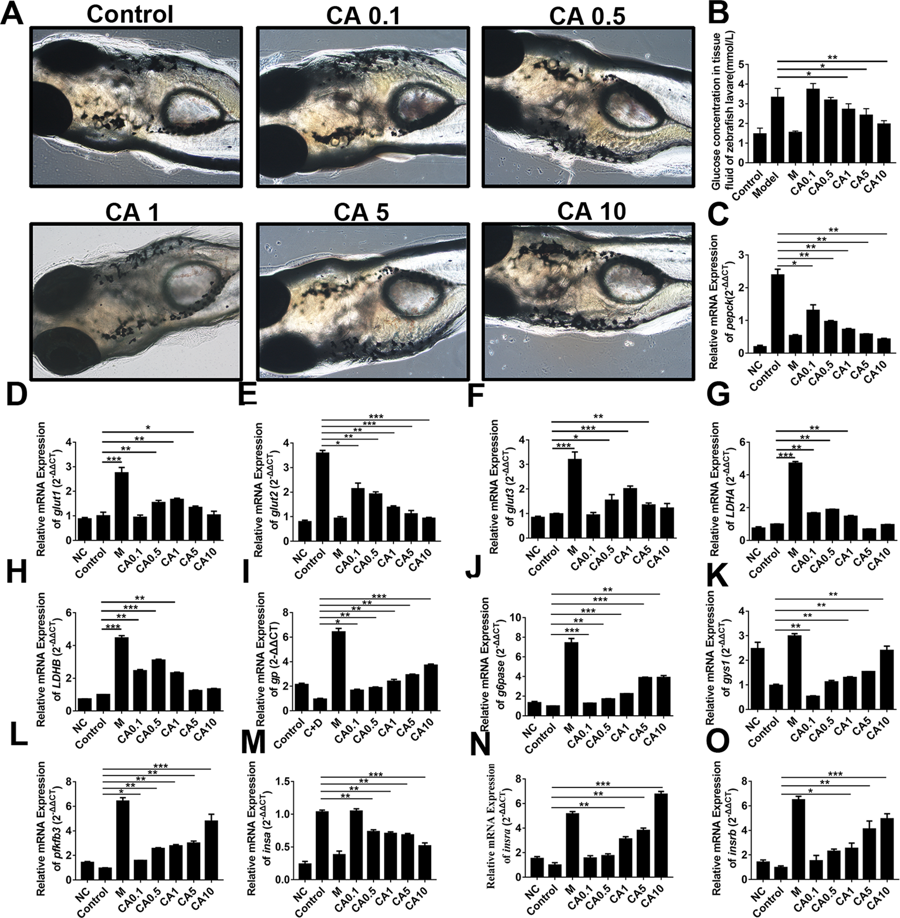
Fig. 4
CA reduced glycogen output in zebrafish model. (A) The toxicity of CA on zebrafish; (B) Glucose concentration in zebrafish tissue fluid treated by different dosages of CA; C-O, PEPCK, GLUT1, GLUT2, GLUT3, LDHA, LDHB, GP, GP6ase, GYS1, PFKFB3, INSα, INSRα and INSRβ mRNA expressions were analyzed by qPCR. P < 0.05, **P < 0.01, ***P < 0.0001. NC, negative control; Control, diabetic control; M, metformin.
Figure Data
Acknowledgments
This image is the copyrighted work of the attributed author or publisher, and
ZFIN has permission only to display this image to its users.
Additional permissions should be obtained from the applicable author or publisher of the image.
Full text @ Sci. Rep.