
IMAGE
Fig. 3
- ID
- ZDB-IMAGE-171206-59
- Genes
- Publication
- Liu et al., 2017 - Deficient Cholesterol Esterification in Plasma of apoc2 Knockout Zebrafish and Familial Chylomicronemia Patients
- All Figures
- Figures for Liu et al., 2017
Image
|
Figure Caption
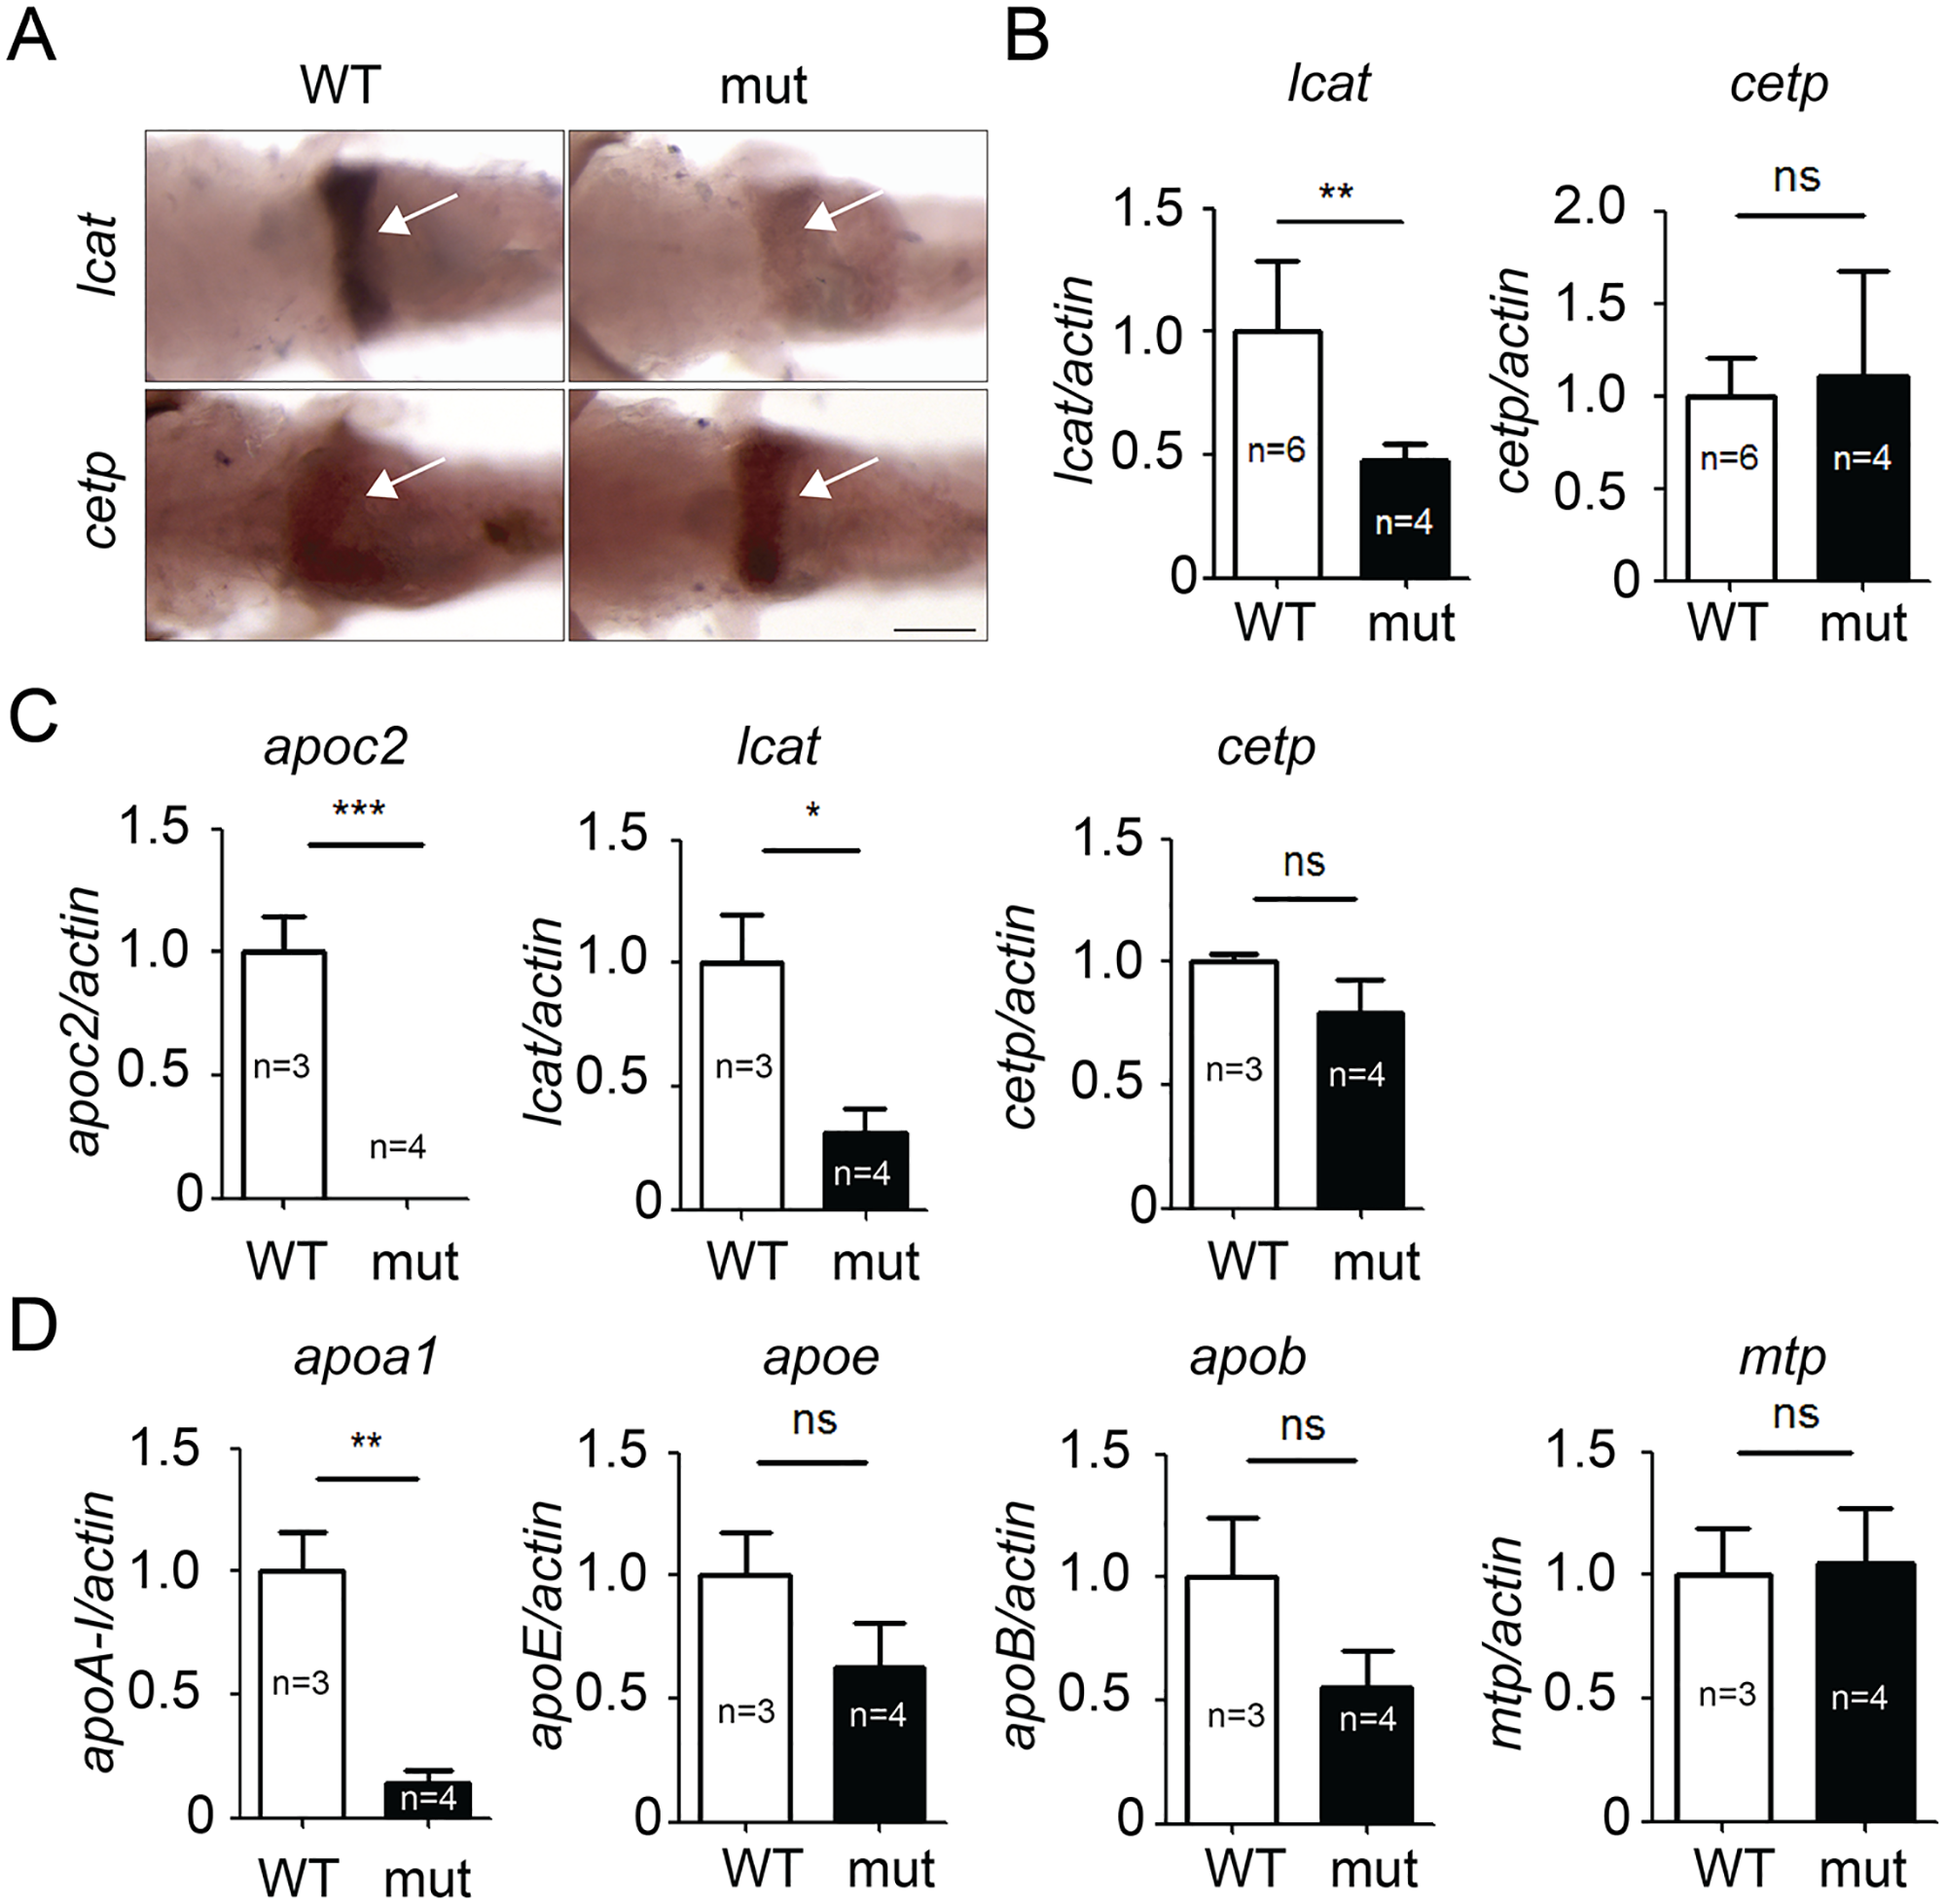
Fig. 3
Expression of lcat, but not cetp, is significantly decreased in apoc2 mutant zebrafish.
In situ hybridization (A) and qPCR (B) results showing lcat and cetp mRNA expression in 5.3 dpf zebrafish embryos. mRNA expression of apoc2, lcat and cetp (C) and apoa1, apoe, apob and mtp (D) in adult zebrafish liver. Results are mean±s.e.m.; numbers of biological replicates are indicated on the graphs; *P<0.05, **P<0.01 and ***P<0.001 (Student’s t-test).
Figure Data
Acknowledgments
This image is the copyrighted work of the attributed author or publisher, and
ZFIN has permission only to display this image to its users.
Additional permissions should be obtained from the applicable author or publisher of the image.
Full text @ PLoS One