
Fig. 6
|
Fig. 6
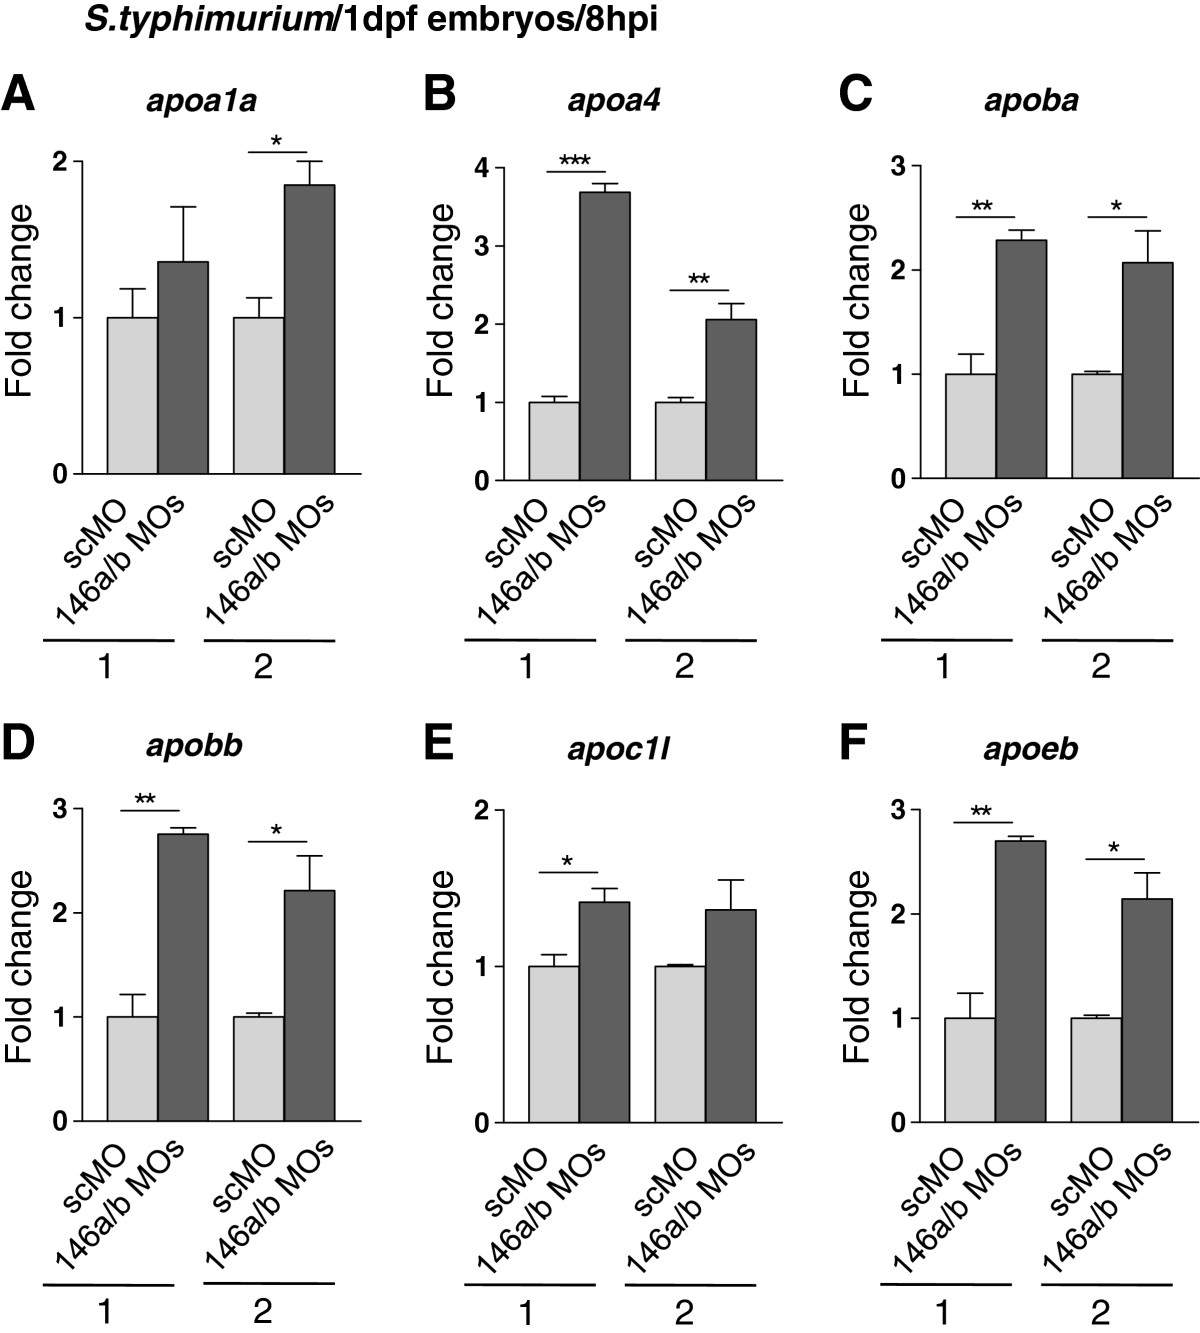
Increased infection-induction of apolipoprotein gene expression under conditions of combined miR-146a and miR-146b knockdown. (A-F) Embryos were injected with control morpholino (scMO) or with a combination of 146aMO1 and 146bMO1 (146a/bMOs) and infected with S. typhimurium as described in Figure 5. Gene expression levels of six apolipoprotein genes, apoa1a (A), apoa4 (B), apoba (C), apobb (D), apoc1l (E), and apoeb (F), were analyzed by qPCR in two replicate infection experiments (1 and 2) and relative expression levels are shown with the lowest expression level set at 1. Data are the mean ± SEM of triplicate qPCR measurements. Asterisks indicate significant differences (*, P < 0.05; **, P <0.01) determined by an un-paired t-test.