
Fig. 3
|
Fig. 3
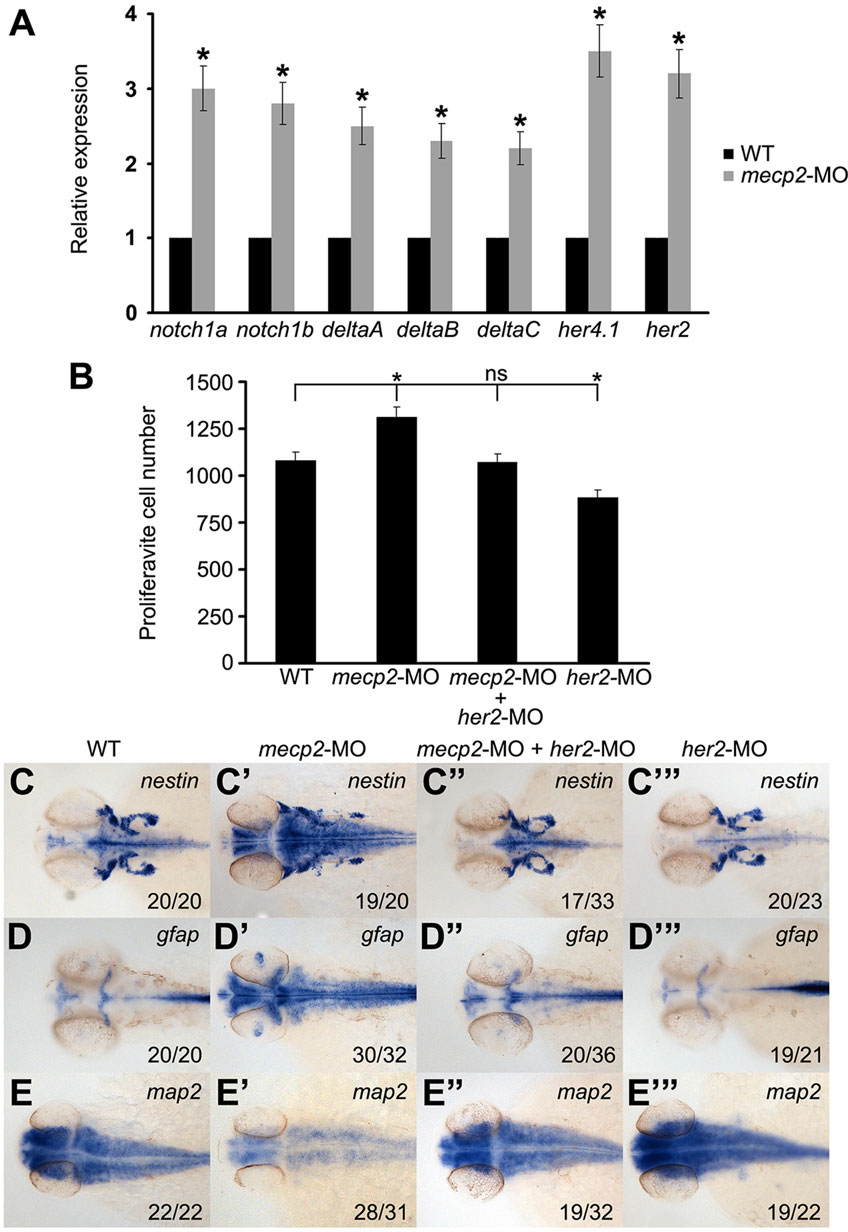
mecp2 mediates her2 expression to control neural cell differentiation. (A) Quantitative real-time PCR analysis of related gene expression in wild-type (WT) embryos and mecp2 morphants, normalized to gapdh. Measurements are the mean±s.d. from three independent experiments. *P<0.05. (B) Number of proliferative cells labeled with Tg(ef1α:mAG-zGem) returned to the normal level in mecp2 morphants co-injected with her2-MO, compared with wild-type embryos at 48hpf. Accordingly, knockdown of her2 decreased neural cell proliferation. Statistics of all groups were calculated by comparison with the wild-type group. Error bars indicate the s.d. *P<0.05; ns, not significant. (C–E′′′) The neural progenitor marker nestin and astrocyte marker gfap increased whereas the neuronal marker map2 decreased in mecp2 morphants (C′,D′,E′) that were partially rescued by co-injection with her2-MO (C′′,D′′,E′′), compared with controls (C,D,E). Accordingly, nestin and gfap were downregulated, whereas map2 was upregulated in her2 morphants (C′′′,D′′′,E′′′), compared with the wild-type (C,D,E) at 48hpf. Dorsal views with anterior to the left; numbers in the bottom right corner represent the number of embryos showing the indicated phenotype/total embryos examined.