
Fig. 4
- ID
- ZDB-IMAGE-140709-48
- Genes
- Publication
- Feng et al., 2010 - Dhrs3a regulates retinoic acid biosynthesis through a feedback inhibition mechanism
- All Figures
- Figures for Feng et al., 2010
|
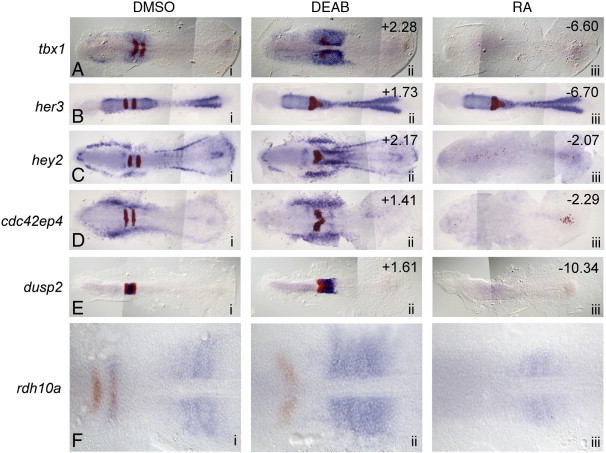
Fig. 4 In situ validation of microarray hits whose expression is decreased in RA-treated embryos and increased in antagonist-treated embryos. (A–E) Dorsal views of five selected microarray hits (blue) and egr2b (red) at 11 hpf. Anterior is to the left in all panels. Column i: control (DMSO) treated; ii: 10 µM DEAB (RA synthesis antagonist) treated; iii: 0.33 µm RA-treated. The numbers in the upper right corners refer to the fold-change in expression level identified on the microarray. (F) Although not represented on the microarray, zebrafish rdh10a is increased in RA-depleted embryos and suppressed in RA-treated embryos.
Reprinted from Developmental Biology, 338(1), Feng, L., Hernandez, R.E., Waxman, J.S., Yelon, D., and Moens, C.B., Dhrs3a regulates retinoic acid biosynthesis through a feedback inhibition mechanism, 1-14, Copyright (2010) with permission from Elsevier. Full text @ Dev. Biol.