
Fig. 2
- ID
- ZDB-IMAGE-130607-25
- Genes
- Publication
- Hans et al., 2013 - Zebrafish Foxi1 provides a neuronal ground state during inner ear induction preceding the Dlx3b/4b-regulated sensory lineage
- All Figures
- Figures for Hans et al., 2013
|
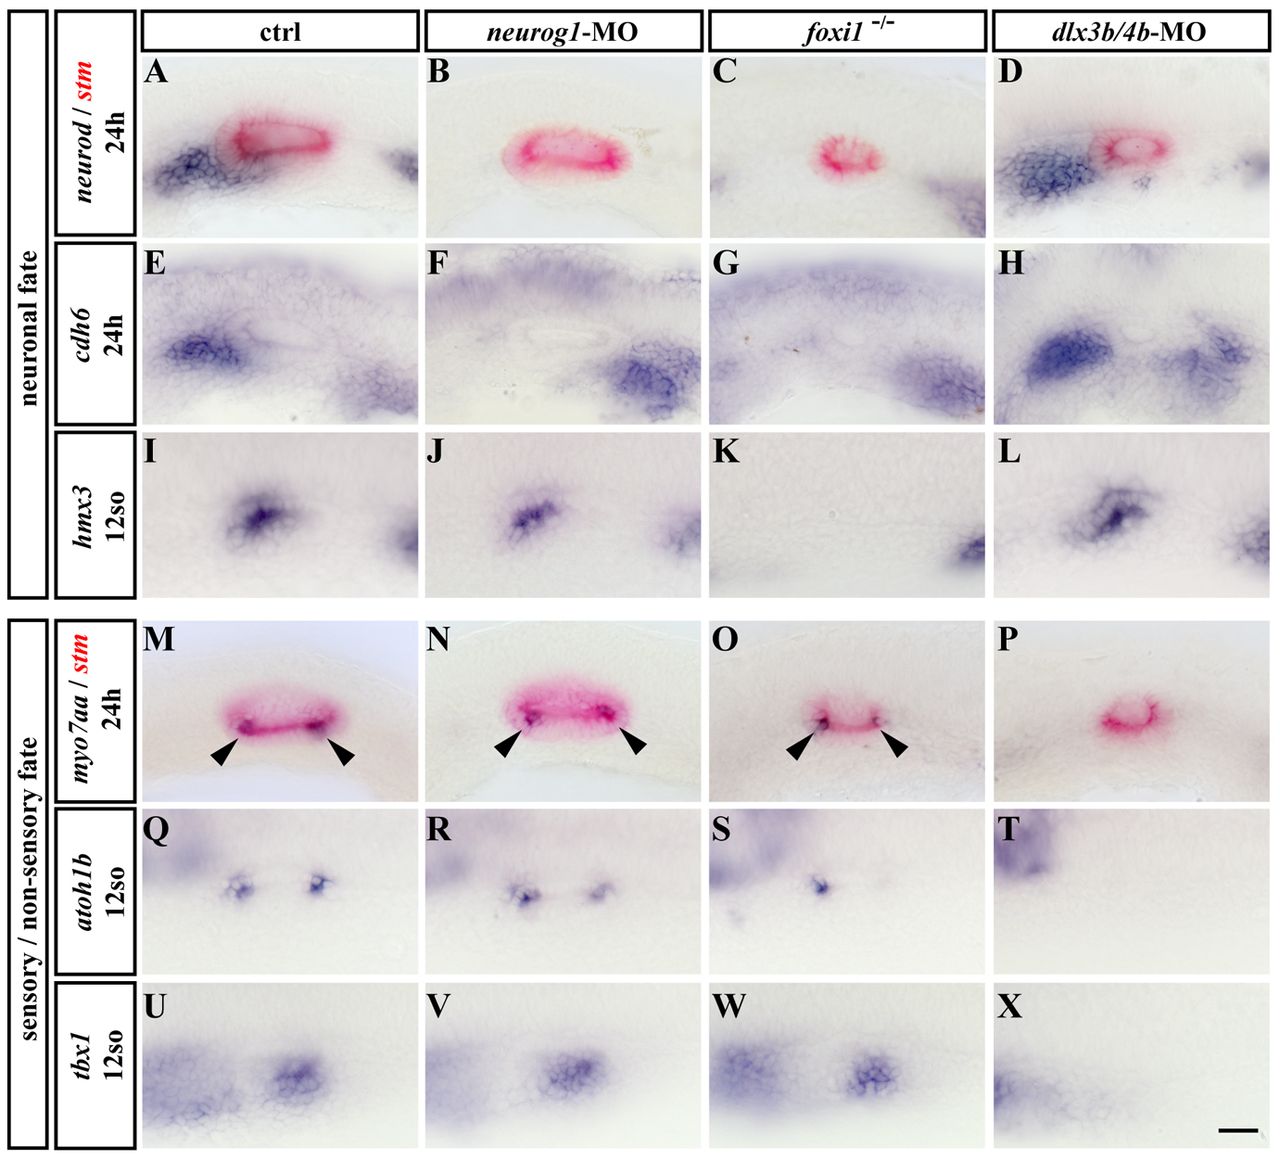
Fig. 2 Foxi1 and Dlx3b/4b regulate the neuronal and sensory lineages of the inner ear. (A-X) Blue: Expression of neurod (A-D), cdh6 (E-H), hmx3 (I-L), myo7aa (M-P), atoh1b (Q-T) and tbx1 (U-X) in control (A,E,I,M,Q,U), neurog1-MO injected (B,F,J,N,R,V), foxi1 mutant (C,G,K,O,S,W) and dlx3b/4b-MO injected embryos (D,H,L,P,T,X). Red: Expression of stm reveals the size of the otic vesicle, which is reduced in foxi1 mutant and dlx3b/4b-MO injected embryos. A-H,M-P are lateral views with anterior to the left at 24 hpf. I-L,Q-X are dorsolateral views with anterior to the left at the 12-somite stage. Arrowheads indicate the position of the sensory patches. Scale bar: 40 μm.