
Fig. 2
|
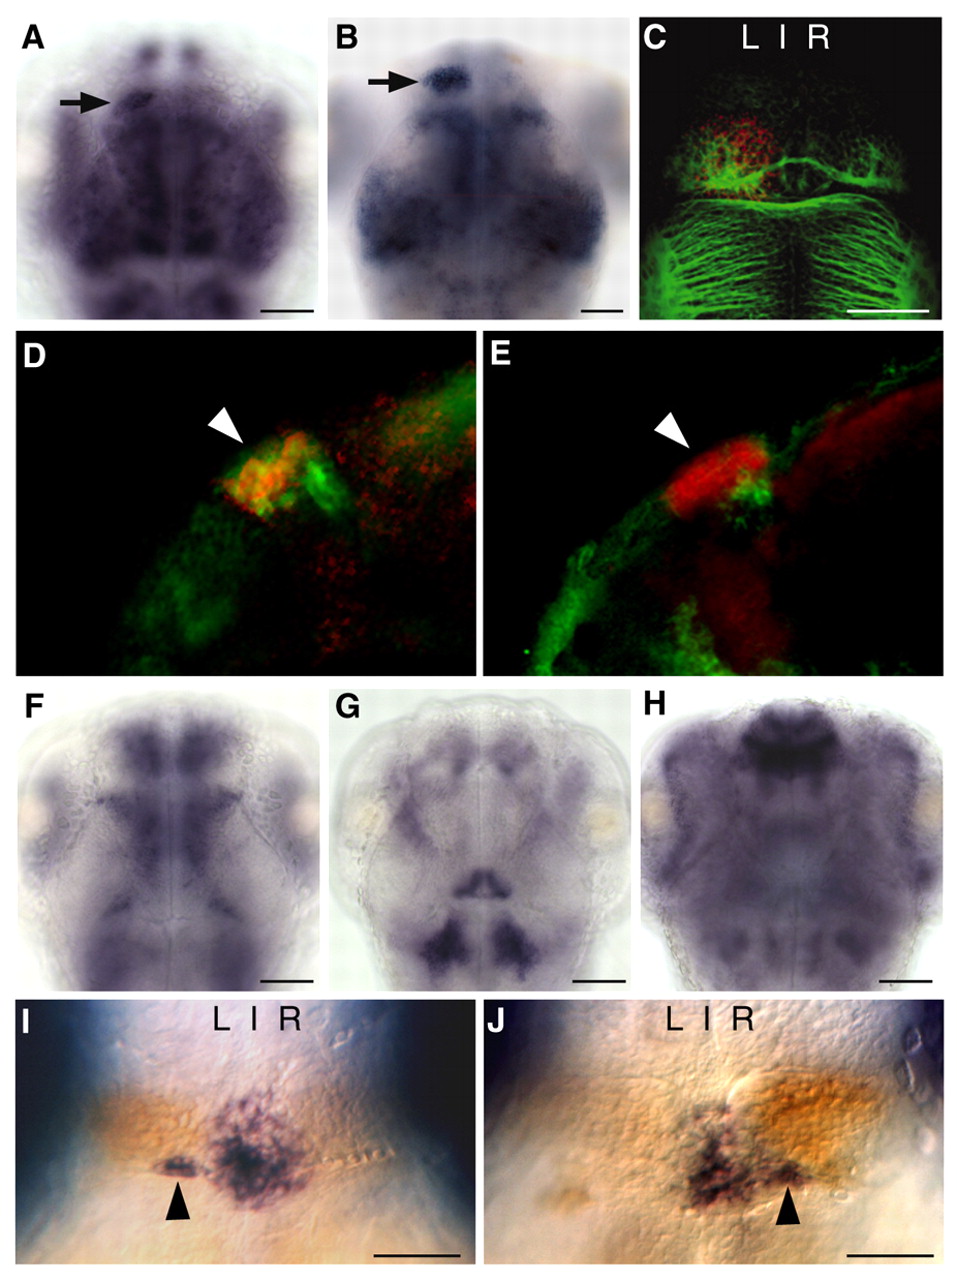
Fig. 2 Asymmetric expression of nrp1a in the dorsal diencephalon. (A,B) Left-sided expression of nrp1a (black arrow) is detected by 2 days (A) and increases by 4 days (B). (C) nrp1a expression (red) overlaps with the dense neuropil of the left habenula revealed by anti-acetylated tubulin immunolabeling (green) at 4 days. (D,E) The nrp1a-expressing neurons (red) are a subset of the Lov-immunoreactive population (D, green) and are also distinct from Ron-immunoreactive cells (E, green) of the left habenula (arrowheads). (F-H) Expression of (F) nrp1b, (G) nrp2a and (H) nrp2b was not detected in the habenular nuclei. (I,J) Laterality of nrp1a expression (orange) correlates with parapineal position (otx5 expression, black arrowheads) in (I) mock-injected (94±2% left bias, n=89) and (J) spaw MO-injected 4-day-old larvae (56±2% sinistral and 44±2% dextral, n=96). A-C and F-J are dorsal views of the brain; C and D are lateral views of composite Z-stack confocal images through the left habenula. Left (L) and right (R) sides of the brain are indicated. Scale bars: 50 μm.