
Fig. 4
- ID
- ZDB-IMAGE-111215-20
- Genes
- Antibodies
- Publication
- Nguyen et al., 2011 - A high level of liver-specific expression of oncogenic KrasV12 drives robust liver tumorigenesis in transgenic zebrafish
- All Figures
- Figures for Nguyen et al., 2011
|
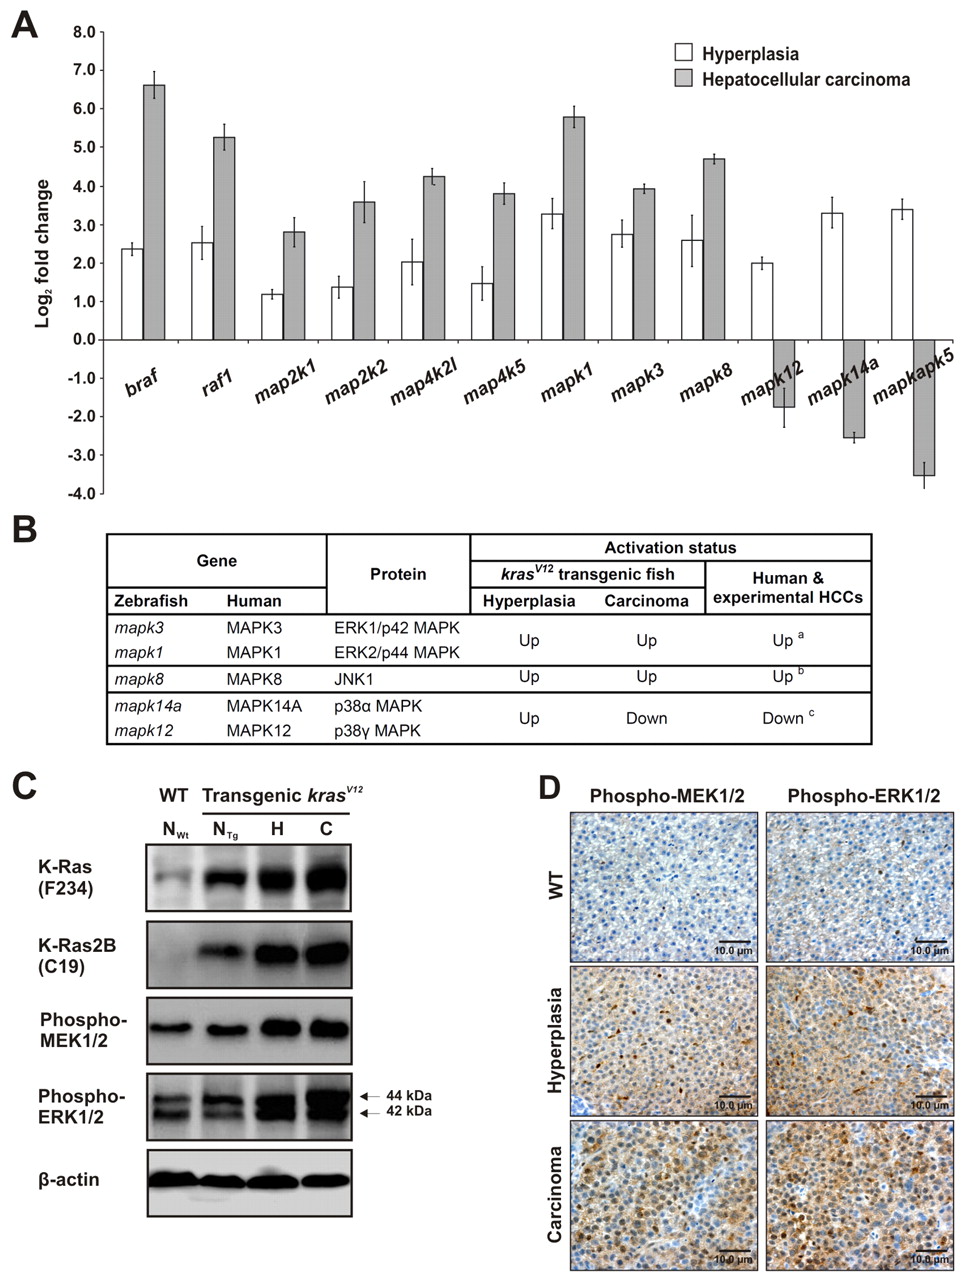
Fig. 4 Hyperactivation of the MAPK signaling pathway in krasV12 transgenic zebrafish. (A) Determination of expression levels of various kinase genes by qRT-PCR in liver hyperplasia (3 mpf) and carcinoma (9 mpf). The expression levels of these genes in each WT and transgenic liver sample were first measured and normalized with the expression level of β-actin (n=5 each). The log2 fold changes in expression in the transgenic samples as compared with matched WT sample are presented. (B) Comparison of MAPK family expression during liver tumorigenesis in krasV12 transgenic zebrafish, human liver cancer and other experimental models of HCC. a(Schmidt et al., 1997); b(Wurmbach et al., 2007; Chang et al., 2009); c(Wurmbach et al., 2007). (C) Western blots of total proteins from WT normal liver (NWt) and kras V12 transgenic liver showing normal liver morphology (NTg), hyperplastic liver (H) or HCC (C) to detect total Kras (F234), Kras2B (C19) isoform, phospho-MEK1/2 and phospho-ERK1/2 (also known as phospho-p44/42 MAPK). Arrows: double bands of phospho-ERK1/2 (44 kDa and 42 kDa). β-actin, internal control for equal loading. (D) Immunohistochemical analysis of paraffin-embedded liver sections from WT (control; top row), 3-mpf transgenic (hyperplasia; middle row) and 9-mpf transgenic (carcinoma; bottom row) fish. Sections were stained with antibodies against phospho-MEK1/2 or phospho-ERK1/2. Scale bars: 10 μm.