
Fig. S3
- ID
- ZDB-IMAGE-110429-20
- Genes
- Publication
- Fujita et al., 2011 - Assembly and patterning of the vascular network of the vertebrate hindbrain
- All Figures
- Figures for Fujita et al., 2011
|
Fig. S3
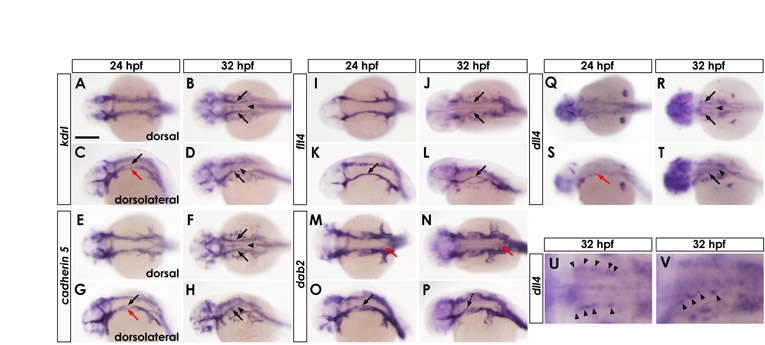
Expression patterns of endothelial markers. (A-V) Whole-mount in situ hybridization of 24 hpf (A,C,E,G,I,K,M,O,Q,S) and 32 hpf (B,D,F,H,J,L,N,P,R,T,U,V) wild-type zebrafish embryos, probed for kdrl (A-D), cadherin 5 (E-H), flt4 (I-L), dab2 (M-P) or dll4 (Q-V). Dorsal view (A,B,E,F,I,J,M,N,Q,R,U) and dorsolateral view (C,D,G,H,K,L,O,P,S,T,V), rostral is to the left. U and V show magnified portions of the hindbrain from R and T, respectively. Expression of kdrl and cadherin 5 is detected in cranial vessels including PHBC (black arrows), BA (arrowheads), and LDA (red arrows). Expression of flt4 and dab2 is detected in venous vessels including PHBCs (black arrows), although reduced at later stages (dashed black arrows). Weak expression of dab2 is also detectable in LDA (red arrows in M,N). Expression of dll4 is detected in arterial vessels, including BA (arrowheads in R,T) and LDA (red arrow in S). Punctate expression of dll4 is also detectable in central areas of the PHBC (black arrows in R,T, and arrowheads in magnified images in U,V). Scale bar: in A, 200 μm for A-T and 62 μm for U,V.