
Fig. 1
- ID
- ZDB-IMAGE-101021-51
- Genes
- Publication
- Mueller et al., 2010 - Spatio-temporal regulation of Wnt and retinoic acid signaling by tbx16/spadetail during zebrafish mesoderm differentiation
- All Figures
- Figures for Mueller et al., 2010
|
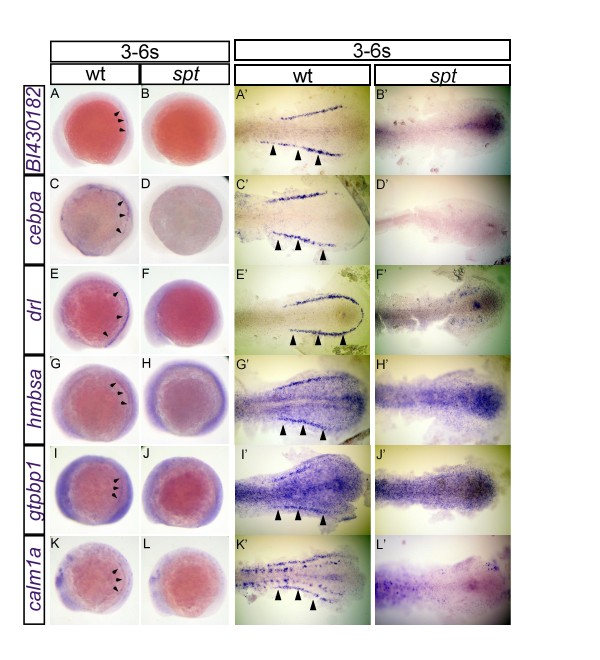
Fig. 1 Expression of validated candidate genes from the 4/5-somite microarray. Changes in the expression of BI430182 (A, B, A′, B′), cebpa (C, D, C′, D′), drl (E, F, E′, F′), hmbsa (G, H, G′, H′), gtpbp1 (I, J, I′, J′) and calm1a (K, L, K′, L′) were visualized using in situ hybridization in wild-type (A, A′, C, C′, E, E′, G, G′, I, I′, K and K′) and spt embryos (B, B′, D, D′, F, F′, H, H′, J, J′, L and L′). All embryos are oriented with posterior to the right. Whole-mount embryos (A-L) are shown in lateral view while de-yolked and flat-mounted embryos (A′-L′) are shown in dorsal view. Flat-mounted embryos (A′-L′) show only the posterior half of the embryos for high-magnification view. All embryos were fixed at the 3 to 6-somite stage. Arrowheads point to specific intermediate mesoderm expression domain