
Fig. 1
- ID
- ZDB-IMAGE-090220-49
- Genes
- Publication
- Carreira-Barbosa et al., 2009 - Flamingo regulates epiboly and convergence/extension movements through cell cohesive and signalling functions during zebrafish gastrulation
- All Figures
- Figures for Carreira-Barbosa et al., 2009
|
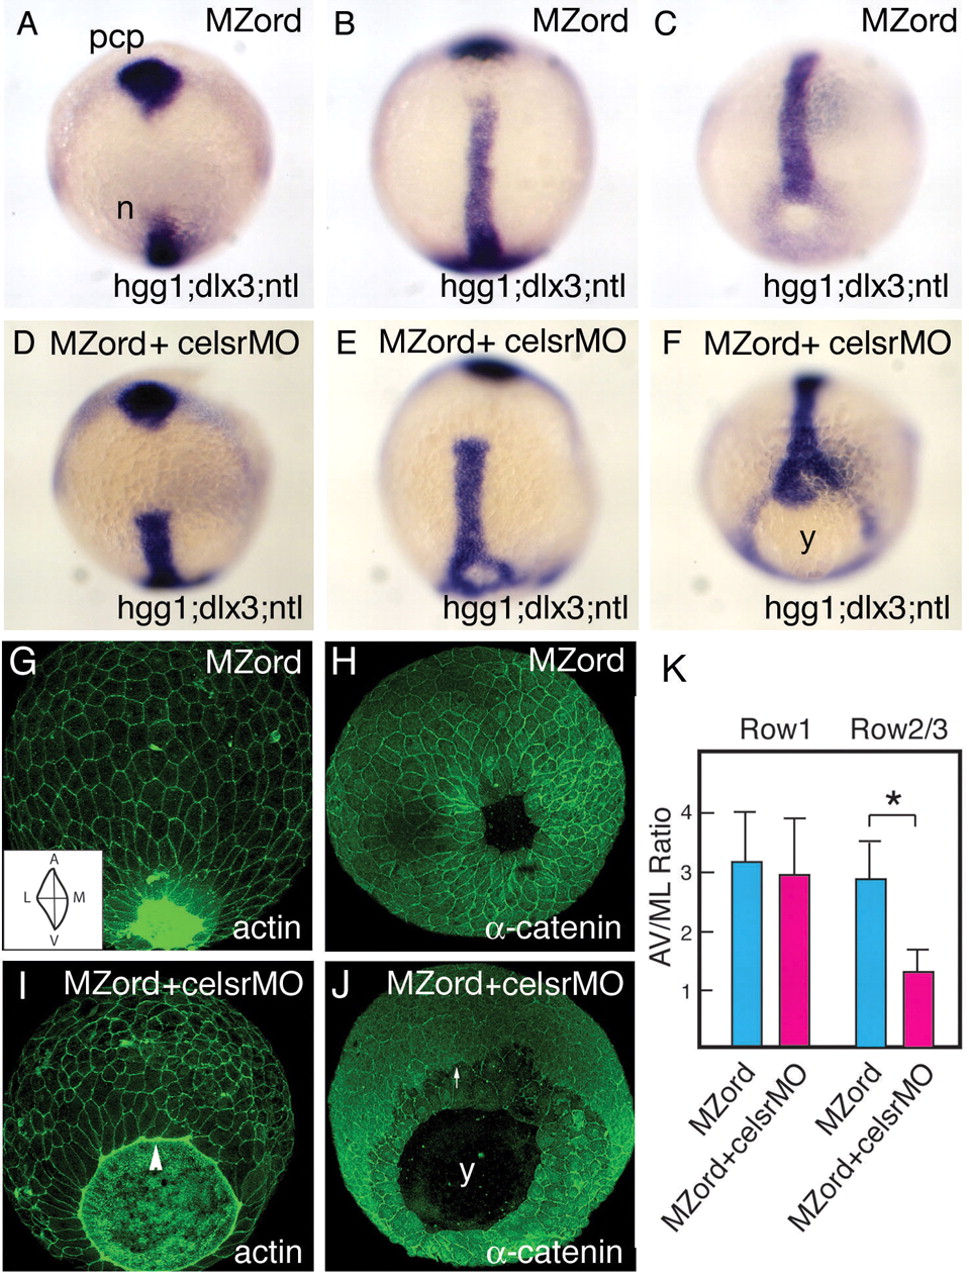
Fig. 1 Injection of celsr1a and celsr1b morpholinos in MZord embryos leads to a defective epiboly phenotype during zebrafish gastrulation. MZord embryos (A,B,C,G,H) or MZord embryos injected with 0.4 pmoles each of celsr1a and celsr1b morpholinos (D,E,F,I,J) were visualised at tail-bud stage with markers, as indicated in the bottom right-hand corner, by in situ hybridisation. hgg1 was used to indicate the prechordal plate (pcp), ntl for the prospective notochord (n) and germ ring blastopore margin, and dlx3 for the anterior edge of the neural plate (A-F). Embryos were also visualised at 90% epiboly with phalloidin for actin (G,I) or anti-α-catenin antibody (H,J). An arrowhead represents the leading edge of the EVL with the actin cable being formed (I). An arrow indicates the leading edge of deep cells (J). Note that the deep cells are delayed from the leading edge of the enveloping layer in the mutant/morphant embryos. y, yolk. (K) Cell elongation of the EVL along the animal-vegetal (AV) axis and the mediolateral (ML) axis at 90% epiboly is quantified as AV/ML ratio (see the inset of G), and the measurement is made using ImageJ from 80 cells (four embryos of each group). Cells that are attached with the actin cable are expressed as `Row1', whereas cells that are not attached to that as `Row2/3'. Means and standard deviations (s.d.) are shown, and an asterisk indicates a statistically significant difference (P<0.05; Student's t-test).